
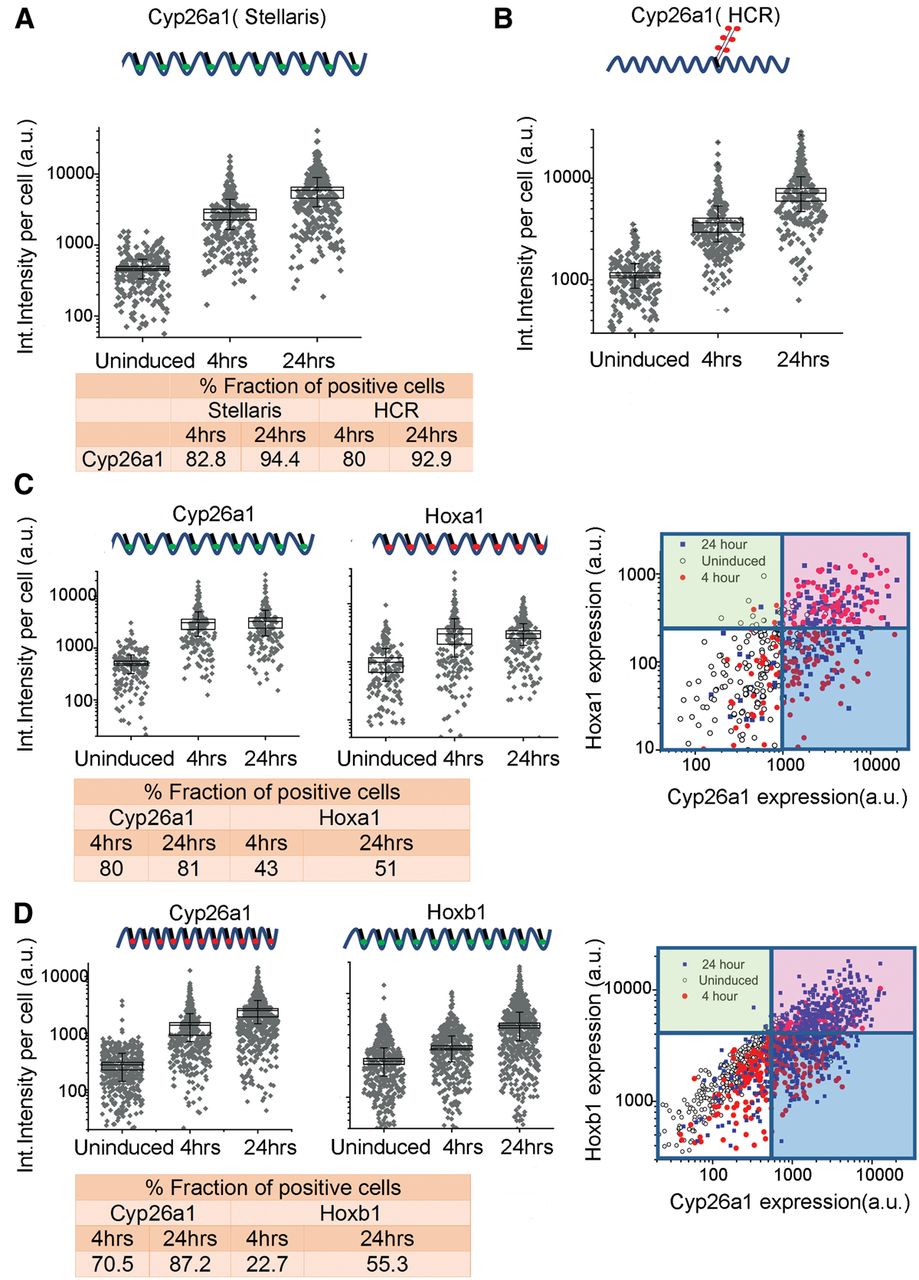
Single-molecule fluorescence in situ hybridization (FISH) analysis of gene expression in ES cells. (A,B) Quantification of single-color FISH data using either the Stellaris multiprobe approach (A) or the hybridization chain reaction (HCR) method (B) to measure expression of Cyp26a1. Each point represents total integrated intensity in arbitrary units per cell analyzed for uninduced colonies or colonies induced with RA for 4 or 24 h. The y-axis is on a log10 scale. A 90% threshold of the uninduced distribution is used to estimate levels above which cells are “on” for expression of a gene. (C) Dual-color Stellaris FISH analysis using Cyp26a1-q570 and Hoxa1-q670 probes. (D) Dual-color Stellaris FISH analysis using Cyp26a1-q670 and Hoxb1-q570 probes. In C and D, total integrated intensity in arbitrary units is determined for each color in each cell. Lines on the 2D plot are generated corresponding to the 90% level of the uninduced cells for that color. The white box represents cells that are scored as off for both genes, the red box represents cells on for both genes, and the green and blues boxes represent cells that are positive for a single probe. For A–D, all experiments used a minimum of 169 total cells from at least nine different colonies for analysis. The fraction of positive cells for each probe and time point are indicated at the bottom of the respective panels.


