
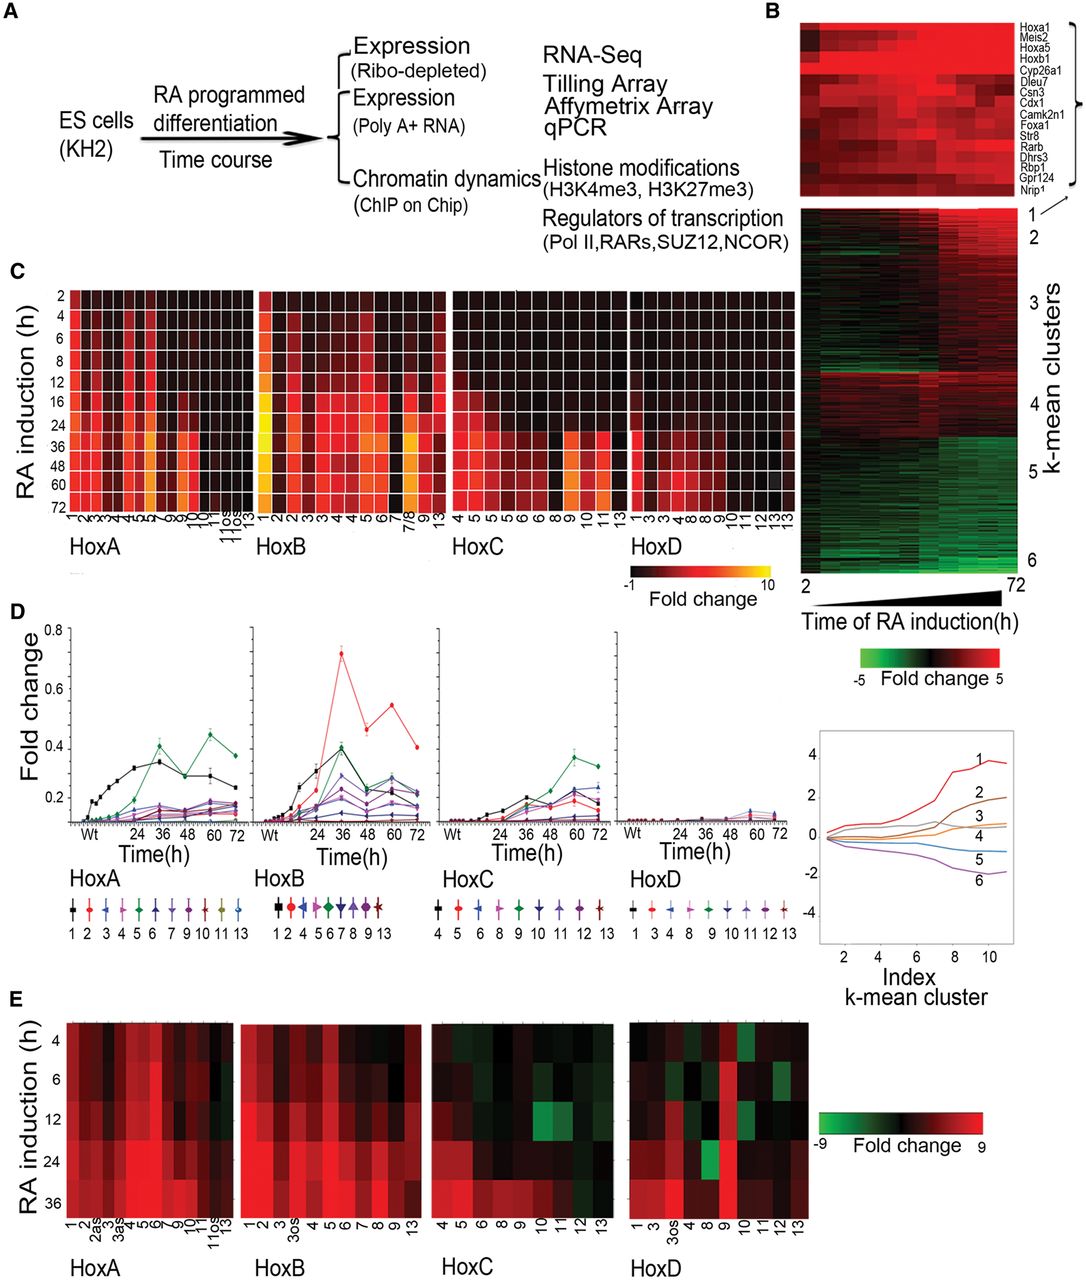
Analysis of changes in Hox and global gene expression during RA-induced differentiation of mouse ES cells. (A) Flow chart outlining overall experimental strategy. (B) Heatmap showing global changes in gene expression upon RA induction compared with uninduced ES cells as analyzed on Affymetrix Mouse Genome 430 2.0 arrays. The lower panel shows the distinct induction profiles of six clusters, identified by k-means clustering. Expression values are the average value from three independent biological replicates. The middle panel displays a heatmap of global changes in gene expression upon RA-induced differentiation; k-means clusters are indicated on the right. Only clusters with an absolute value of cluster mean >0.5 are shown. The upper panel shows changes in the expression profile for 15 of the most rapidly induced genes in cluster 1, which includes Hox genes and genes for the cofactors (Meis). (C) Heatmap of relative changes in Hox gene expression upon RA induction compared with uninduced ES cells as analyzed on Affymetrix Mouse Genome 430 2.0 arrays. Genes in the HoxA and HoxB clusters display a more rapid and robust induction than those of the HoxC and HoxD clusters. Several genes have multiple probes, and results are shown for each. (D) Temporal changes in Hox gene expression induced by RA quantitated by TLDA qPCR microfluidics cards. All data points are the average of three biological and two technical replicates. The y-axis in all clusters is shown on the same scale and illustrates relative levels of induction between Hox clusters. (E) RNA-seq analysis of Hox gene expression in RA treated ES cells compared to uninduced cells. Fold changes are shown as a heatmap.


