
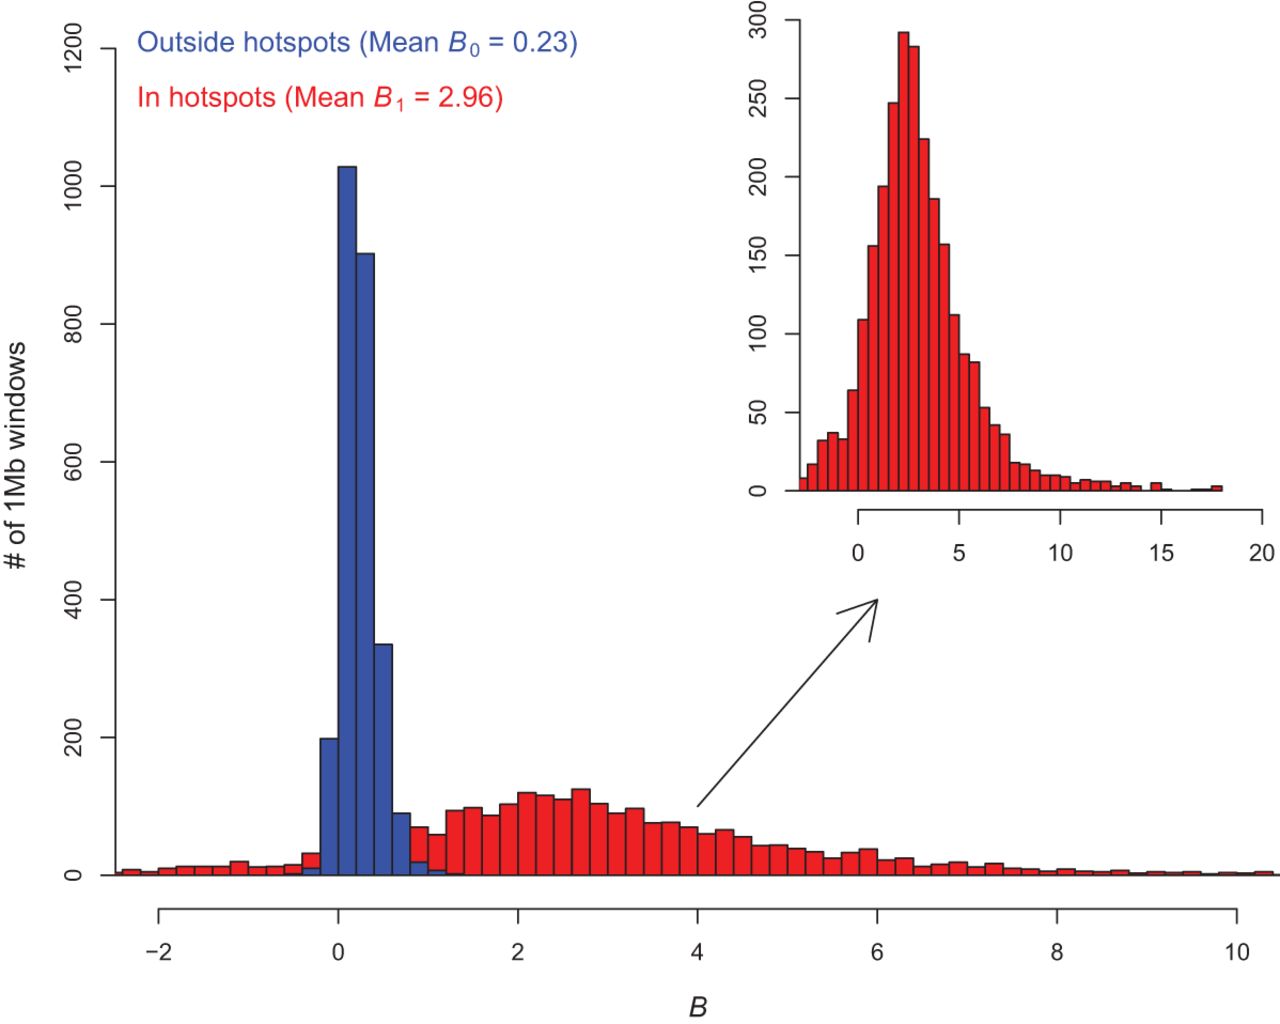
Figure 7.
Distribution of B within and outside of recombination hotspots for 1-Mb windows. Distribution of the estimate of B0 (= outside hotspots, blue) and B1 (= within hotspots, red) for each 1-Mb window. The M3* model was used, and f, the fraction of sites within recombination hotspots, was fixed to the observed fraction. The ratio ρ = B1/B0 was also constrained to be proportional to the ratio of recombination rates within and outside hotspots. In the inset, the distribution of B1 is magnified and extended to the whole range of values.


