
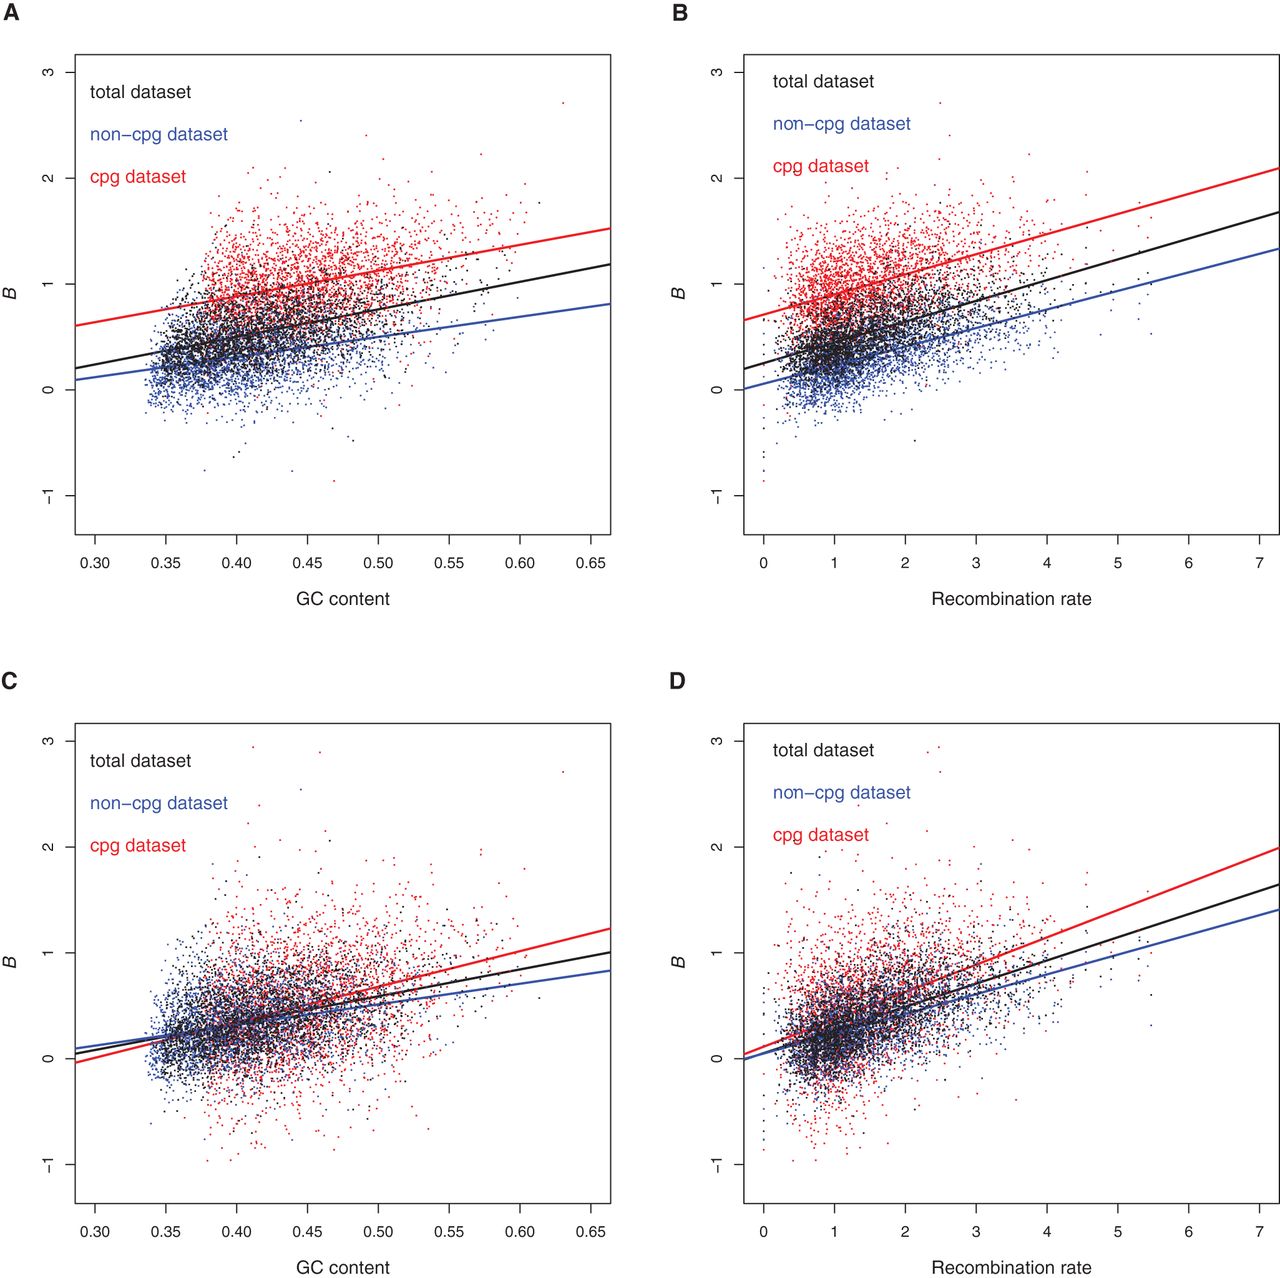
Comparison of the B estimated with and without error correction. Values of B estimated without error correction (M1 model, A,B) and with error correction (M1* model, C,D) as a function of GC content (A,C) and recombination rate (B,D) for the whole data set (black), the non-CpG data set (blue), and the CpG data set (red). To take into account differences in local GC-content and recombination rates between CpG and non-CpG sites in the same window, we measured GC-content over 100 bp and recombination rate over 5 kb around each SNP and then averaged them over each window. When the non-CpG and the CpG data sets are analyzed jointly, recombination rate, GC-content, and the category of sites explain, respectively, 11%, 17%, and 38% of the variance in B without error correction, and 16%, 4%, and 1% with error correction.


