
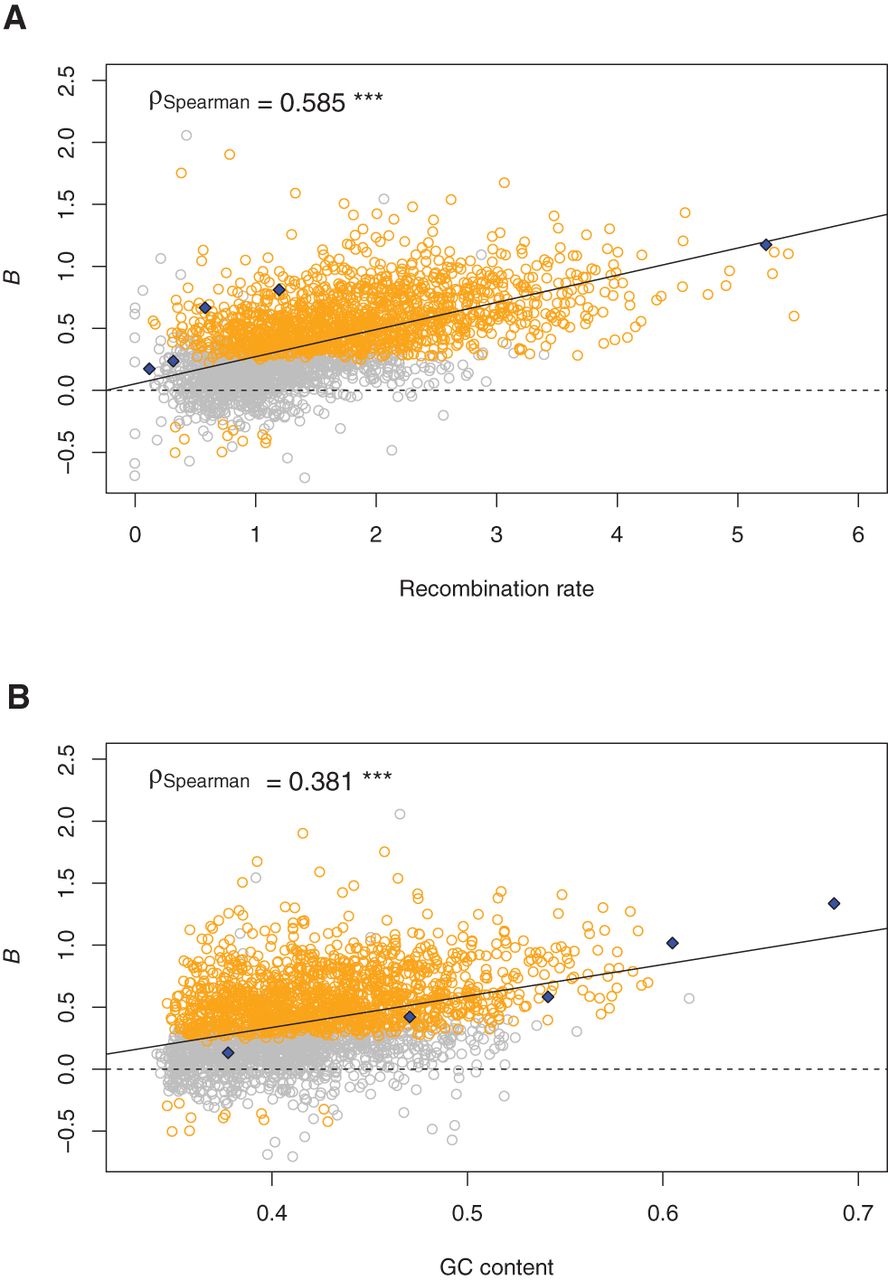
B estimates for 1-Mb windows as a function of recombination rate and GC content. Values of B were estimated on autosomes with the M1* model. Gray (respectively, orange) dots correspond to B values nonsignificantly (respectively, significantly) different from 0. The regression lines and the Spearman correlation coefficients are given in the plots. (***) P-values < 10−15. P-values were computed by a likelihood ratio test with 1 degree of freedom between models M1* and M0*. The blue diamonds correspond to estimates of B on synonymous sites grouped into five recombination rate (A) or GC content (B) quintiles. To be congruent with Figure 5, GC-content was measured over 100 bp and recombination rate over 5 kb around each SNP and then averaged over each window.


