
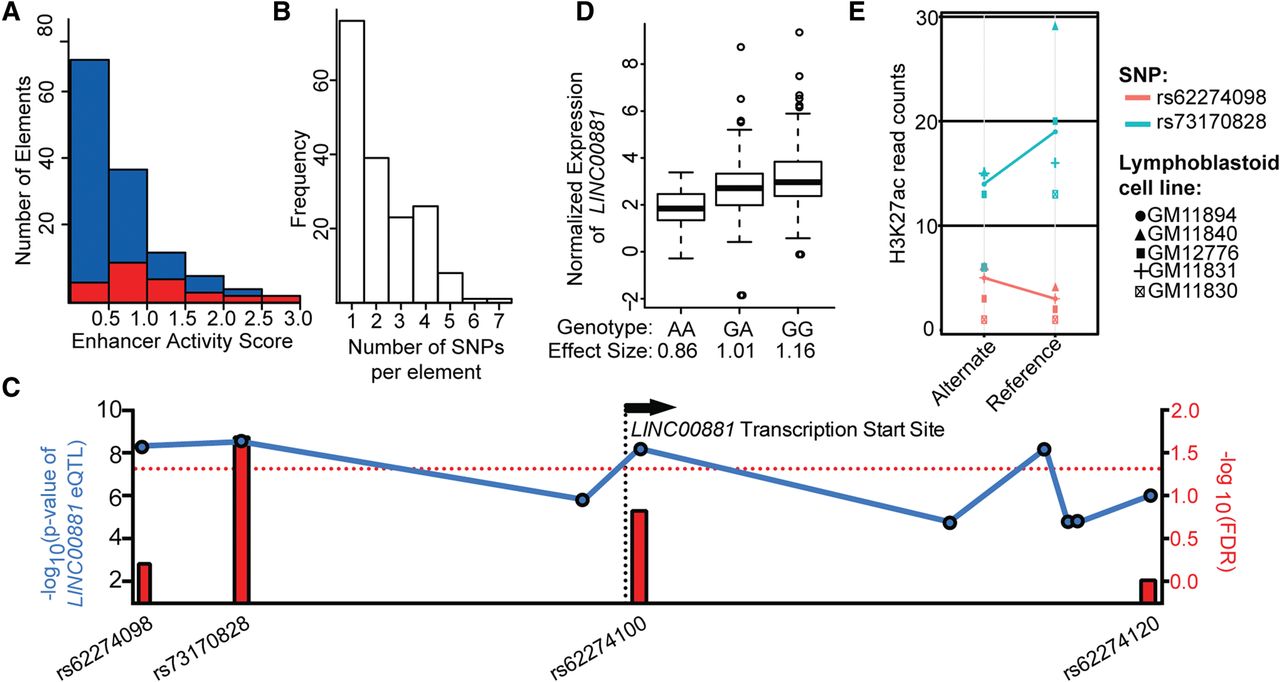
Comprehensive measurement of haplotype-specific regulatory element activity provides mechanistic insights into gene regulation. (A) Distribution of enhancer activity scores for fragments containing regulatory variants (red) and fragments containing nonregulatory variants (blue). (B) Histogram of number of SNPs per assayed element. (C) Manhattan plot of eQTLs for the long noncoding RNA LINC00881. Blue dots indicate −log10 (P-value) of LINC00881 eQTL from the Geuvadis database (left y-axis); red bars indicate −log10(FDR) for variants that alter regulatory activity in the population STARR-seq assay (right y-axis). Red dotted line indicates a FDR = 1.0. (D) Association between normalized expression of long noncoding gene LINC00881 in LCLs as measured by the Geuvadis project (y-axis) and the measured effect size in population STARR-seq assay (x-axis) for SNP rs73170828 (r2 = 0.07, P = 7.6 × 10⁻⁹). (E) Allele-specific H3K27ac analysis of variants rs62274098 and rs73170828, both eQTLs proximal to and 5′ of LINC00881; read counts (y-axis) differed substantially between alleles for rs73170828 (Wilcoxon P = 0.058, binomial P = 0.004) but not for rs62274098 (Wilcoxon P = 0.9; binomial P = 0.92).


