
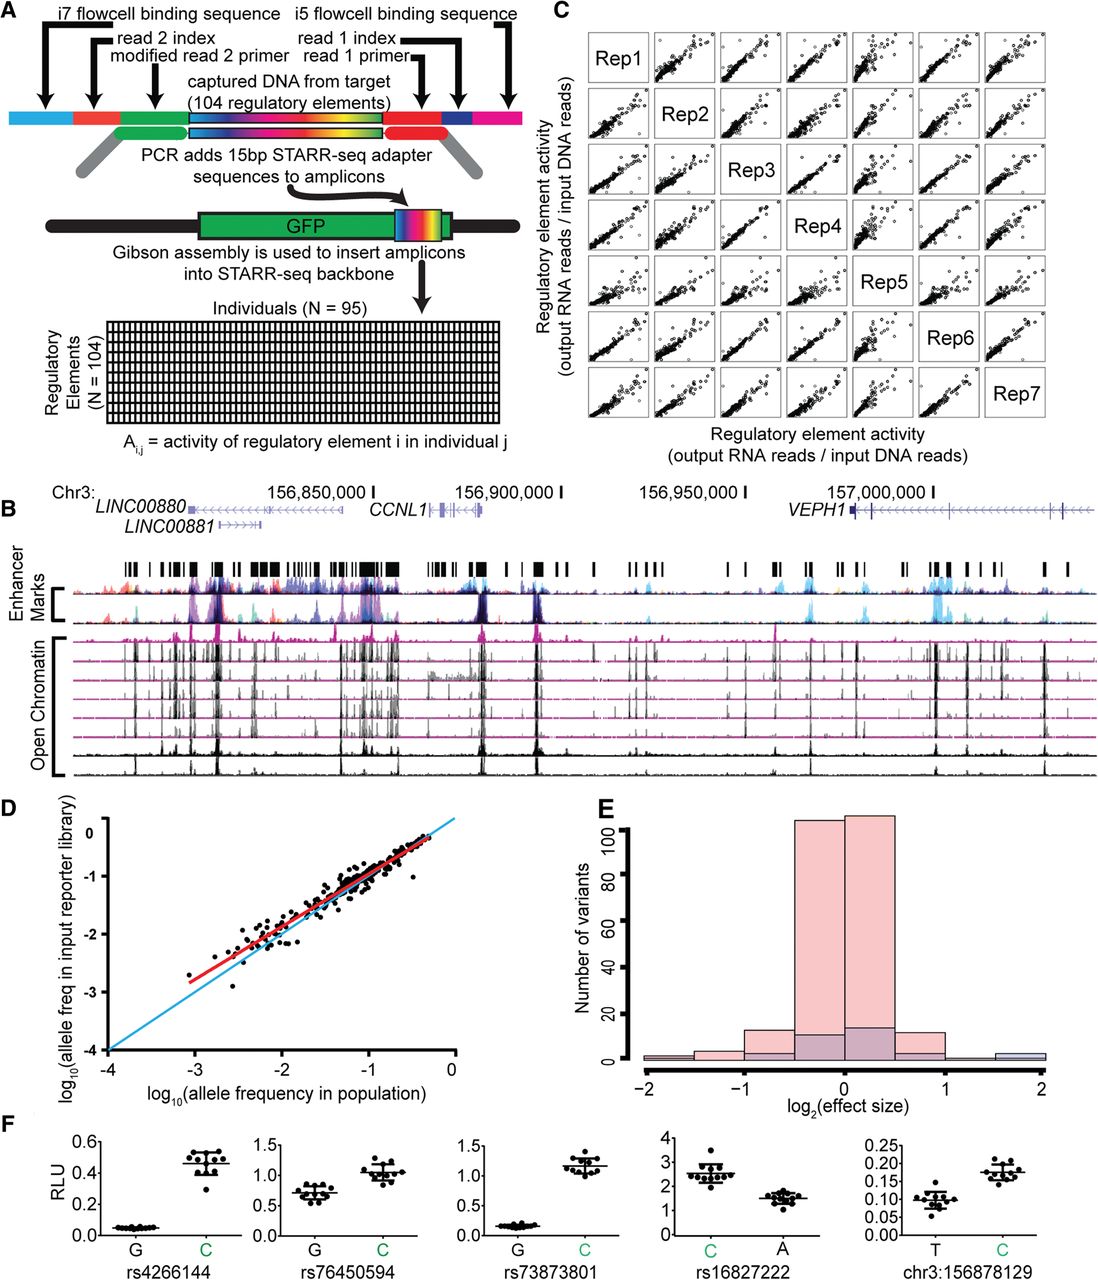
Identification of regulatory variants using population-scale STARR-seq assays. (A) Schematic of population STARR-seq assay design. (B) Candidate regulatory sites were sequenced in 95 members of the Hyperglycemia and Adverse Pregnancy Outcome (HAPO) Study (Urbanek et al. 2013) patient cohort using custom amplicon sequencing. The targeted regions overlap open chromatin (DHSs) in multiple cell types as described in Methods. (C) Population STARR-seq is highly reproducible. Rep1–7 are biological replicates generated from independent transfections. The x- and y-axes represent element activity (output RNA reads/input DNA reads). In each case, Spearman's ρ > 0.90. (D) Plotted is a comparison of the allele frequency of each SNP in the cohort DNA to the allele frequency of each SNP in the resulting reporter library. Allele frequencies of the cohort DNA used are shown on the x-axis, and the allele frequencies in the resulting reporter library are on the y-axis. The allele frequencies are highly correlated, as evaluated by a Pearson correlation (r2 = 0.94, P < 1 × 10⁻⁵). The one-to-one line is shown in blue. The least squares fit is shown in red. (E) Log2(effect sizes) for nonsignificant (pink) and significant (FDR < 0.05, blue) variants. The effect sizes are small and range between 0.25 and 3.96 fold-change. (F) Firefly luciferase assay validations for population STARR-seq. In all cases, the higher expressing allele in our high-throughput reporter assay, shown in green, also had higher luciferase expression.


