
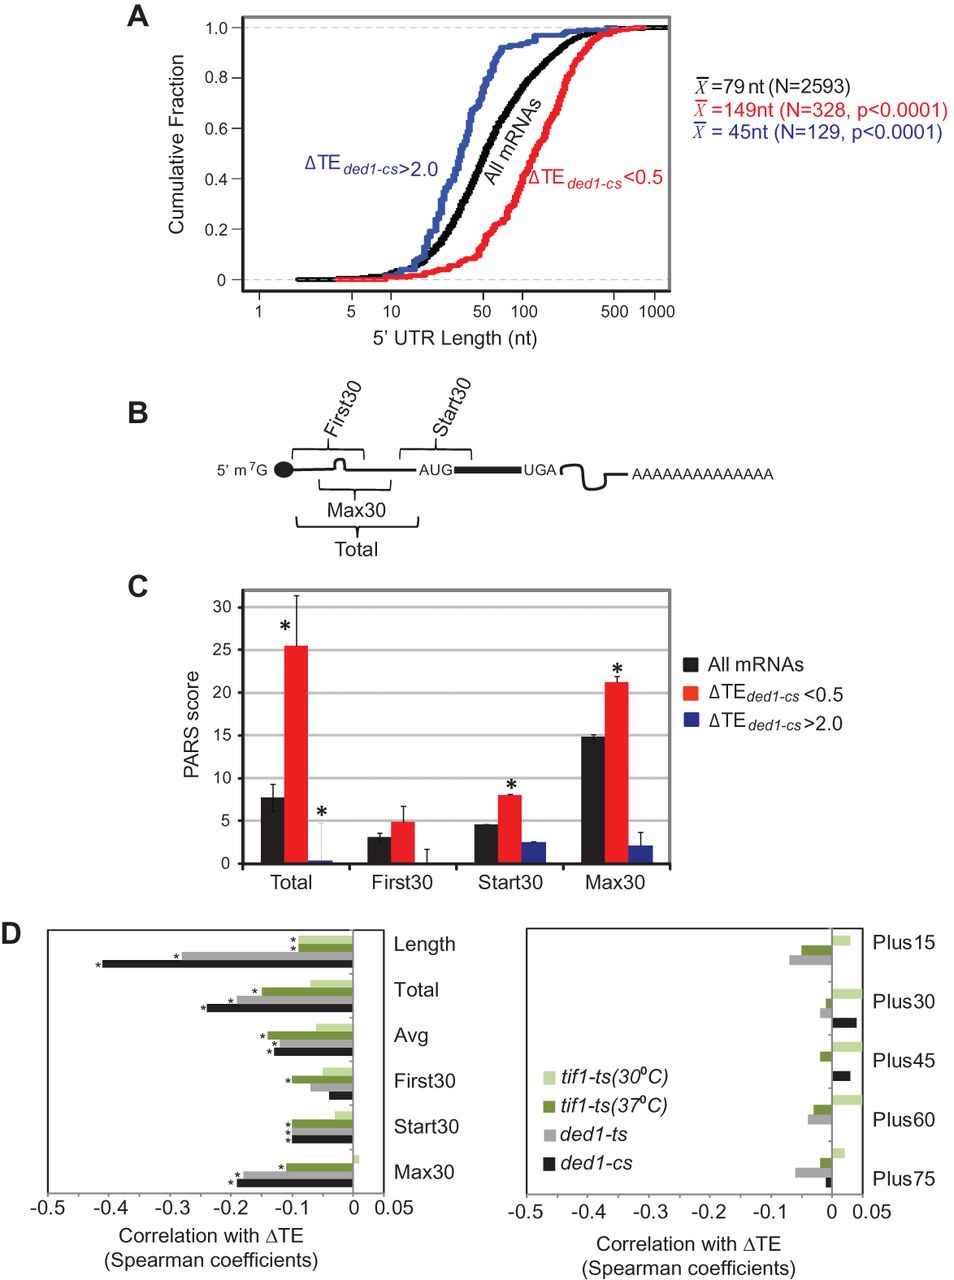
5′ UTRs of Ded1-dependent genes exhibit greater than average length and PARS scores. 5′ UTR features of genes with ≥twofold reductions in TE in ded1-cs cells, for genes curated by Kertesz et al. (2010). (A) Cumulative distributions of 5′ UTR lengths for all 2593 genes, or genes of indicated ΔTE values, with mean lengths (X) for the indicated number of genes (N). P-values of Student's t-tests for statistical significance of the differences between mean lengths for Ded1-dependent genes and genome-average length (79 nt) are shown. (B) Schematic showing 5′ UTR intervals assigned for calculating cumulative PARS scores. (C) Average PARS scores calculated for the indicated gene set for each 5′ UTR interval described in B. (*) P < 0.05. (D) Genome-wide changes in TE are negatively correlated with 5′ UTR length and PARS scores in ded1 and tif1 mutants. Spearman correlation coefficients of ΔTE values in the indicated mutant versus WT cells for the 5′ UTR features described in B and the text. Coefficients with significance levels of P < 10−16 are indicated with asterisks.


