
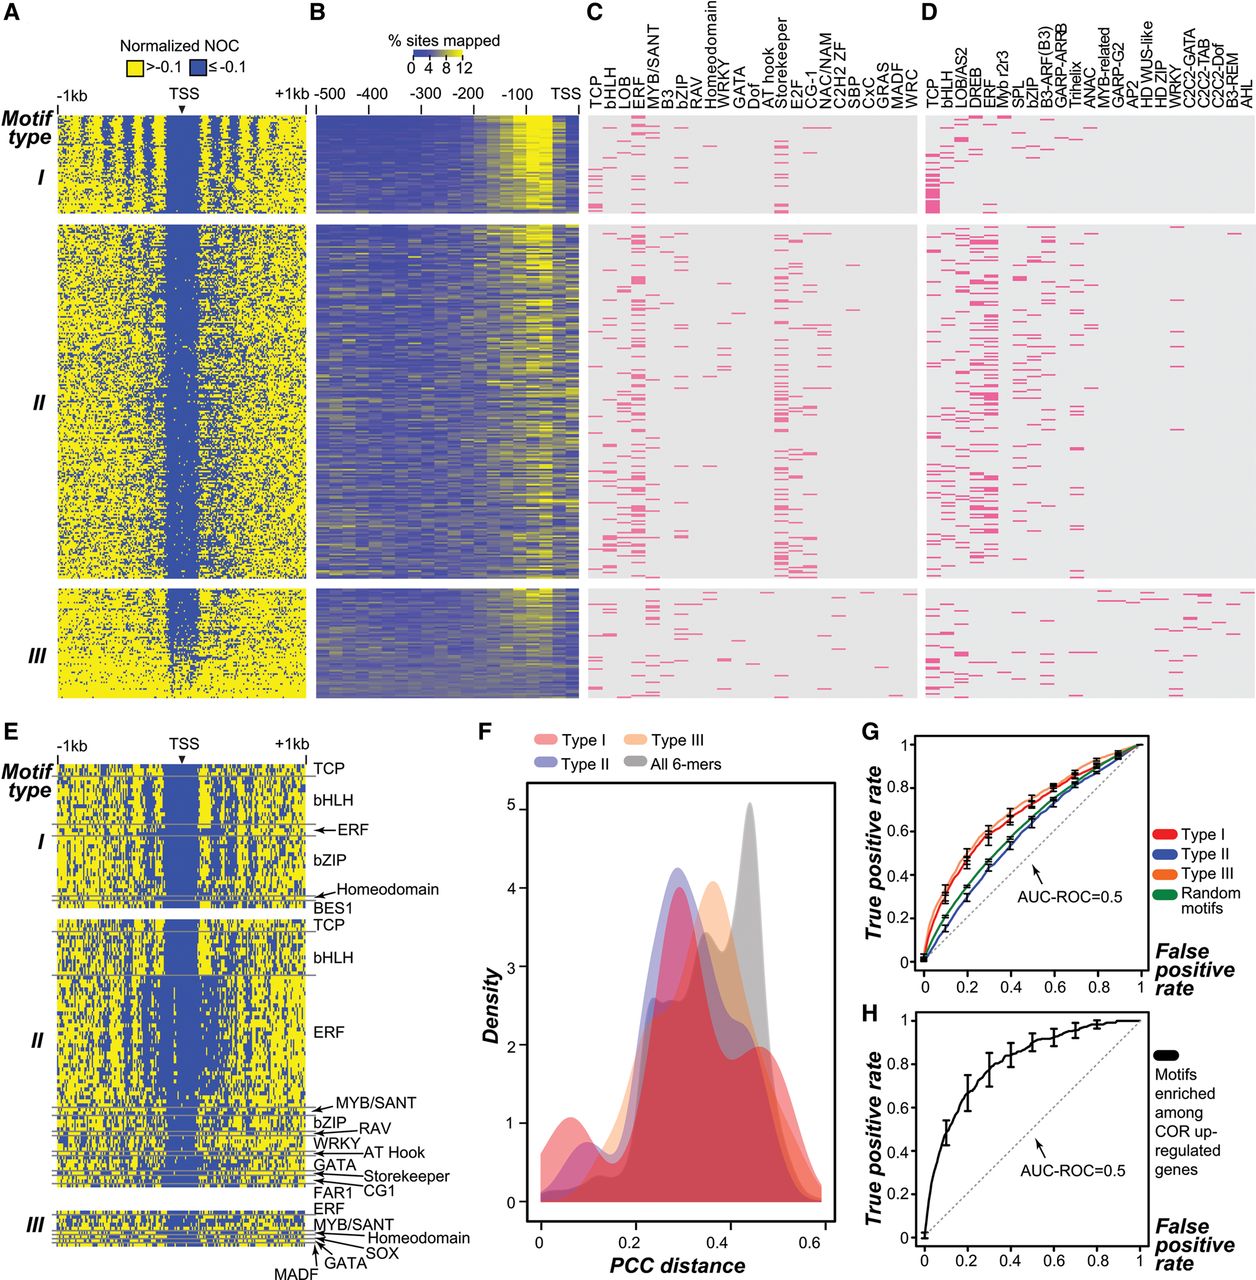
Properties of Type I, II, III motifs. (A) Nucleosome phasing pattern in 1-kb regions flanking 6-mer motif sites. Type I, II, and III motifs are as defined in Figure 3A. (Arrowhead) 6-mer motif position; (blue) lower occupancy; (yellow) higher occupancy. (B) Positional bias of motif sequences located within proximal promoter regions. Color represents the proportion (%) of 6-mer sites in a 25-bp bin compared to the entire region. (C) Families with TFs that likely bind to Type I, II, and III motifs. (Pink) 6-mer with significantly higher in vitro binding affinity (P ≤ 0.01) to a TF in a family (Weirauch et al. 2014) compared to random 6-mers (Methods). (D) TF families that likely bind to Type I, II, and III 6-mer motifs. (Pink) the best matching binding motif from a TF family (Franco-Zorrilla et al. 2014) to a 6-mer with PCC distance ≤0.38 (P < 0.05) (Methods). (E) Nucleosome phasing pattern in 1-kb regions flanking TFBM sites (Weirauch et al. 2014). (F) PCC distance distributions of Type I, II, and III motifs and all 6-mers compared to their top matching TFBMs (Franco-Zorrilla et al. 2014). (G) Performance of gene expression predictive models based on Type I, II, and III as well as randomly chosen 6-mer motifs. (Random guess) gray dotted line. (H) Performance of gene expression predictive models based on motifs enriched among COR-induced genes (black line). (Random guess) gray dotted line; (error bar) the standard error at 0.1 false positive rate intervals; (AUC-ROC) Area Under Curve-Receiver Operating Characteristic.


