
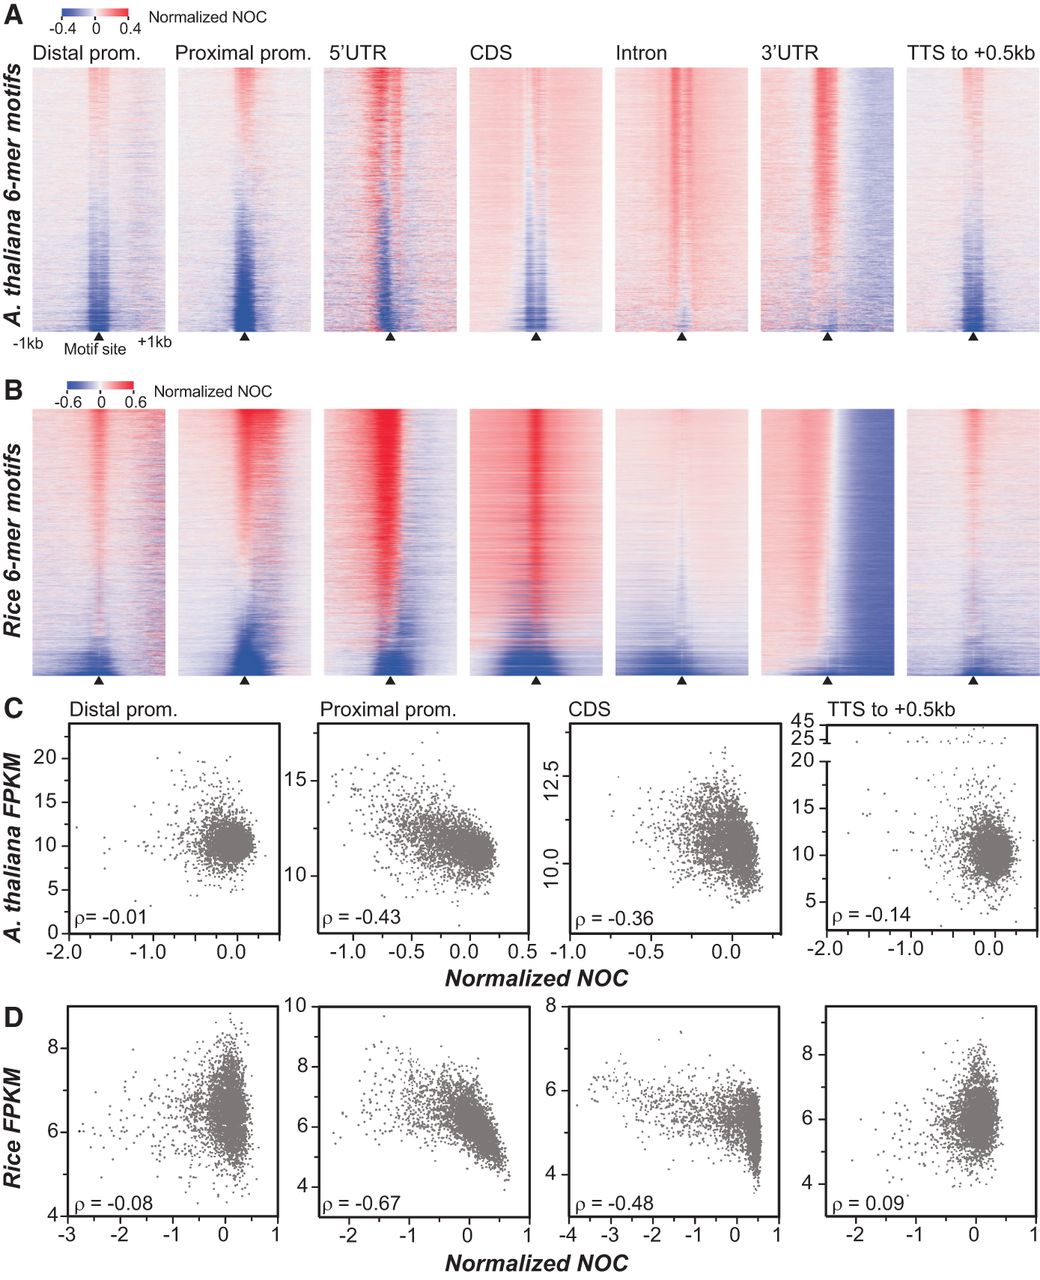
Nucleosome occupancy profiles of 6-mer sites located in different genic and intergenic regions and their relationships to transcript abundance. (A) Heatmaps showing A. thaliana nucleosome occupancy around 6-mer motif sites located within distal promoter, proximal promoter, 5′ untranslated region (5′ UTR), CDS (coding sequences), intron, 3′ UTR, and TTS 3′ (500 bp downstream from TTS) regions. The 4096 6-mers (y-axis) were sorted according to normalized NOCs at the regions centered on the motif sites with those with lower scores (lower nucleosome occupancy) at the bottom. For distal promoter, only divergent genes where the TSS is 1.5 kb away from the TSS of the upstream gene were considered. For TTS 3′ regions, only convergent genes where the TTSs are 500 bp away from the TTS of the downstream gene were included. (Arrowhead) 6-mer motif position. (B) Rice 6-mer motif occupancy profiles in different regions as in A. (C) Relationships between median normalized NOC scores of each 6-mer and median transcript abundance of genes with the 6-mer in question located in A. thaliana proximal, distal, CDS, or TTS 3′ regions. (D) Same as C except rice data are used. (ρ) Spearman's rank correlation coefficient.


