
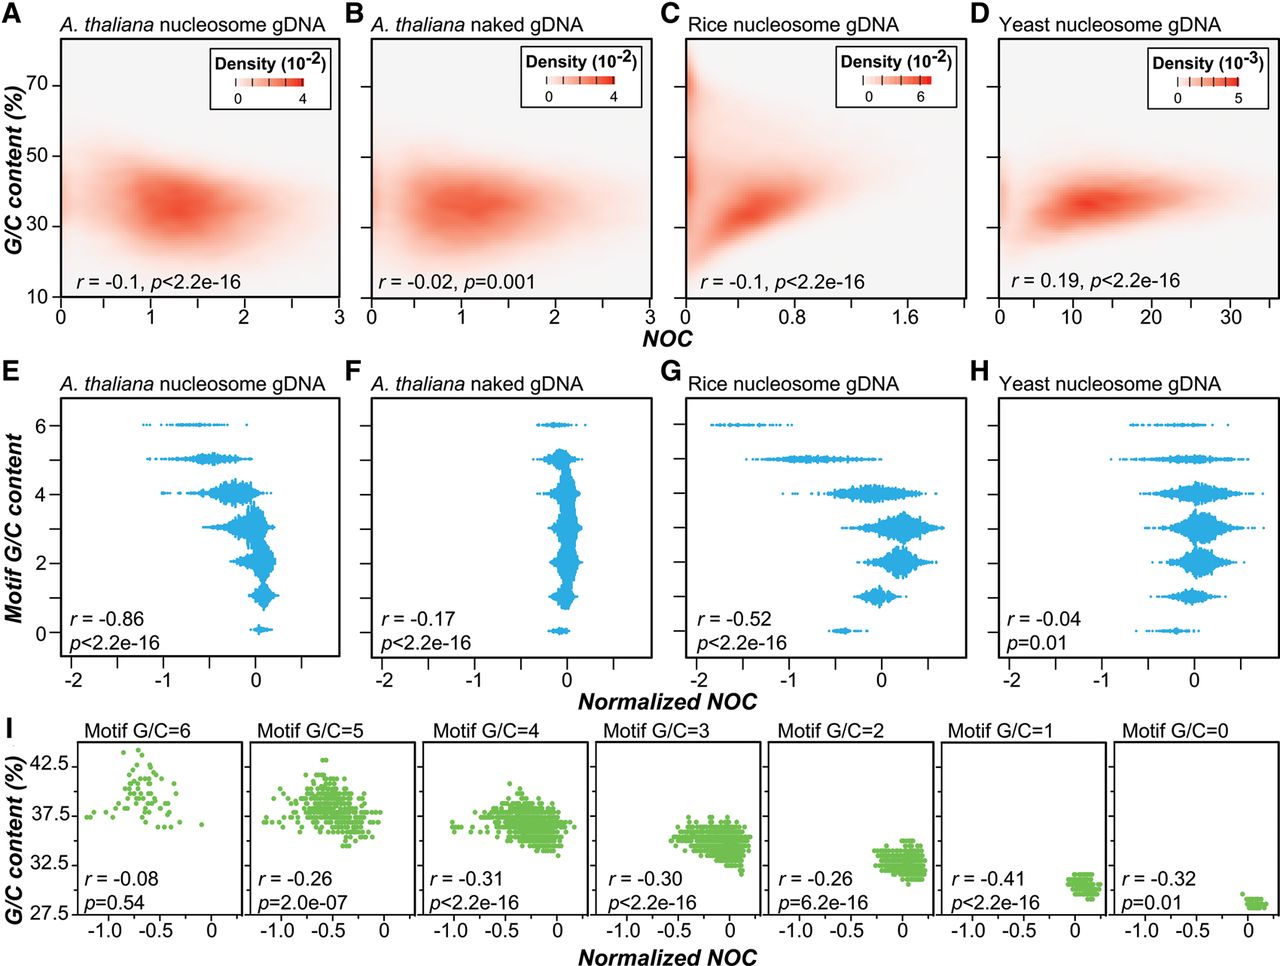
The correlation between nucleosome occupancy and G/C content in A. thaliana, rice, and yeast. (A–D) The correlation between G/C content and nucleosome occupancy determined with A. thaliana nucleosome gDNA (A), A. thaliana naked gDNA (B), rice nucleosome gDNA (C), and yeast nucleosome gDNA data (D). The density plots indicate the probability density of values from 36,000 randomly chosen 150-bp genomic regions. (E–H) Relationships between the normalized NOC scores (NOCs) and the numbers of G/Cs in 6-mers determined with the data indicated in A–D. The normalized NOC score is controlled for background nucleosome occupancy (see Methods). (I) Relationships between the percent G/C content of 200-bp regions centered on 6-mer motif sites and the medians of normalized NOCs of 6-mer motifs with different numbers of G/C nucleotides. (r) Pearson's correlation coefficient.


