
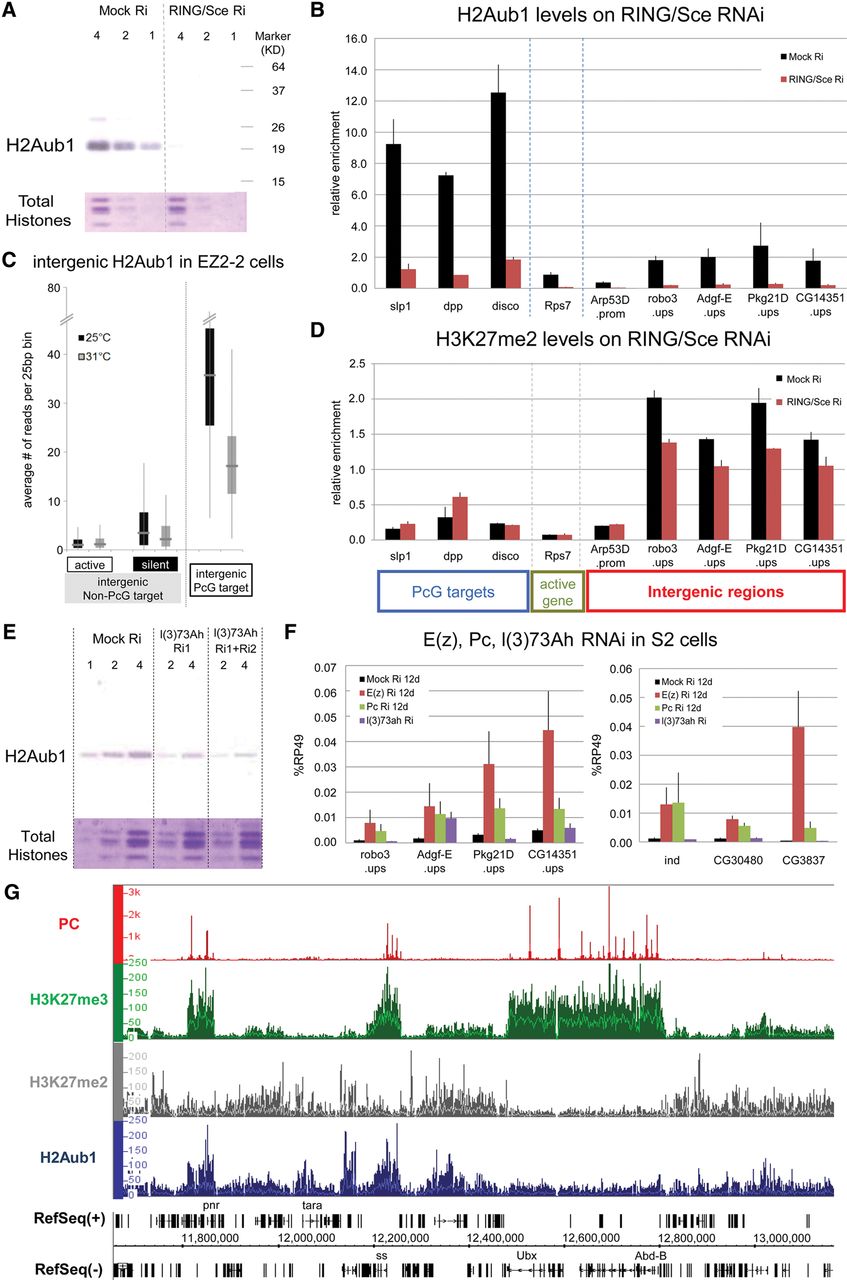
PRC1 involvement in intergenic repression. (A) Western blot analysis shows the loss of total H2AK118ub after 12 d of RING/Sce RNAi on S2 cells. LacZ dsRNA was used as control; twofold serial dilutions of nuclear lysate were loaded; and total histones stained with Coomassie blue served as loading controls. (B) H2AK118ub levels in PcG and intergenic non-PcG target regions were assayed by ChIP-qPCR after treatment of S2 cells with dsRNA for LacZ (control) or RING/Sce. H2AK118ub levels in three PcG target regions, one active gene region, and five intergenic non-PcG target regions were measured by ChIP-qPCR. (C) The H2Aub1 levels of intergenic non-PcG (transcriptionally active or silent) and PcG target regions in EZ2-2 cells were determined from the 25°C and 31°C ChIP-seq data. (D) H3K27me2 levels after RING/Sce knockdown in S2 cells were assayed by ChIP-qPCR compared with control treatment with LacZ dsRNA. (E) Decrease of global H2AK118ub level after RNAi depletion of l(3)73Ah in S2 cells. (F) Expression levels in intergenic and genic non-PcG target regions were measured by RT-qPCR with total RNA from mock-treated and Pc, E(z), or L(3)73Ah-depleted S2 cells. Changes in mRNA levels of l(3)73Ah, Pc and E(z) after knockdown are shown in Supplemental Figures 7G, 7B, and 3B, respectively. (G) Distribution of H2AK118ub (blue) in the genomic region surrounding the bithorax complex as determined by ChIP-seq. For comparison, the distributions of Pc (red), H3K27me3 (green), and H3K27me2 (gray) are also shown, indicating the absence of H2AK118ub at the entire BX-C (from Ubx to Abd-B) but presence in other regions both with and without PC or H3K27me2/3.


