
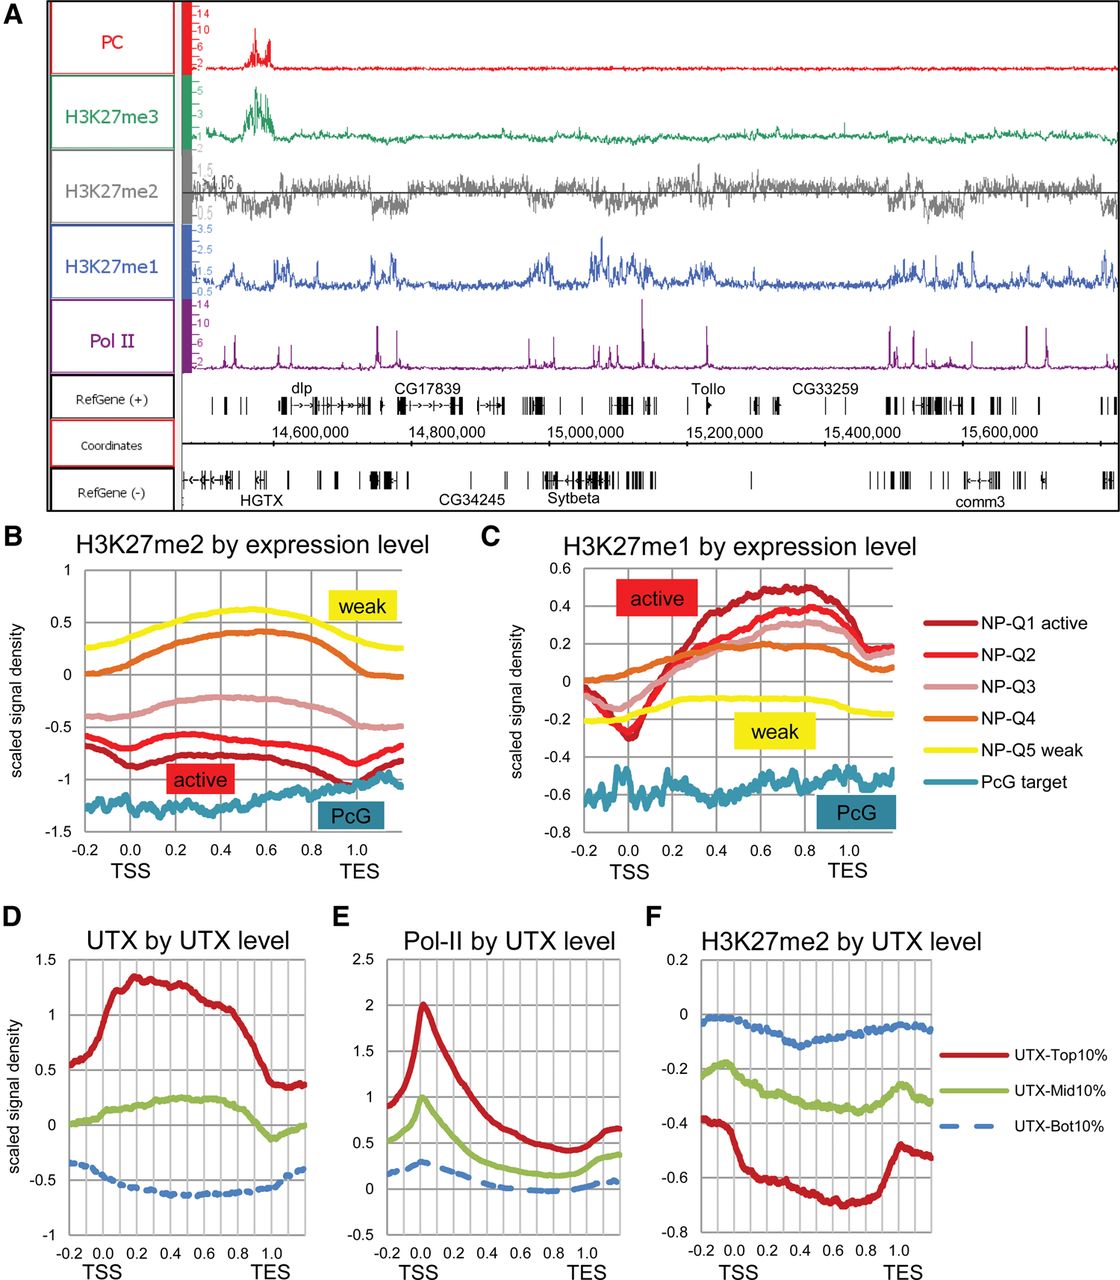
Widespread distribution of H3K27 methylation. (A) Representative genome region showing the distribution of mono- (blue), di- (gray), and trimethylated H3K27 (green). Pc (red), and Pol II (purple) mapped by ChIP-chip in Bg3 cells (the modENCODE Project) or Sg4 cells (this study; Supplemental Fig. 1A). The H3K27me2 track shows the enrichment threshold based on the signal distribution (see Supplemental Fig. 1B–C). (B,C) Meta-gene profiles of H3K27me2 and H3K27me1 for PcG target genes and five subgroups of non-PcG target genes with different expression levels (e.g., NP-Q1 indicates the top 20 percentile active non-PcG target genes) in Bg3 cells (RNA tiling array data from the modENCODE Project). The x-axis represents the positions relative to the transcription start site (TSS; 0.0) and transcription end site (TES; 1.0). ChIP-chip signal values are scaled to the distribution with a mean of zero and a standard deviation of one. The same results normalized to the H3 distribution are shown in Supplemental Figure 1. (D–F) Meta-gene profiles of UTX, Pol II, and H3K27me2 for three subgroups of genes with different UTX binding levels in Sg4 cells.


