
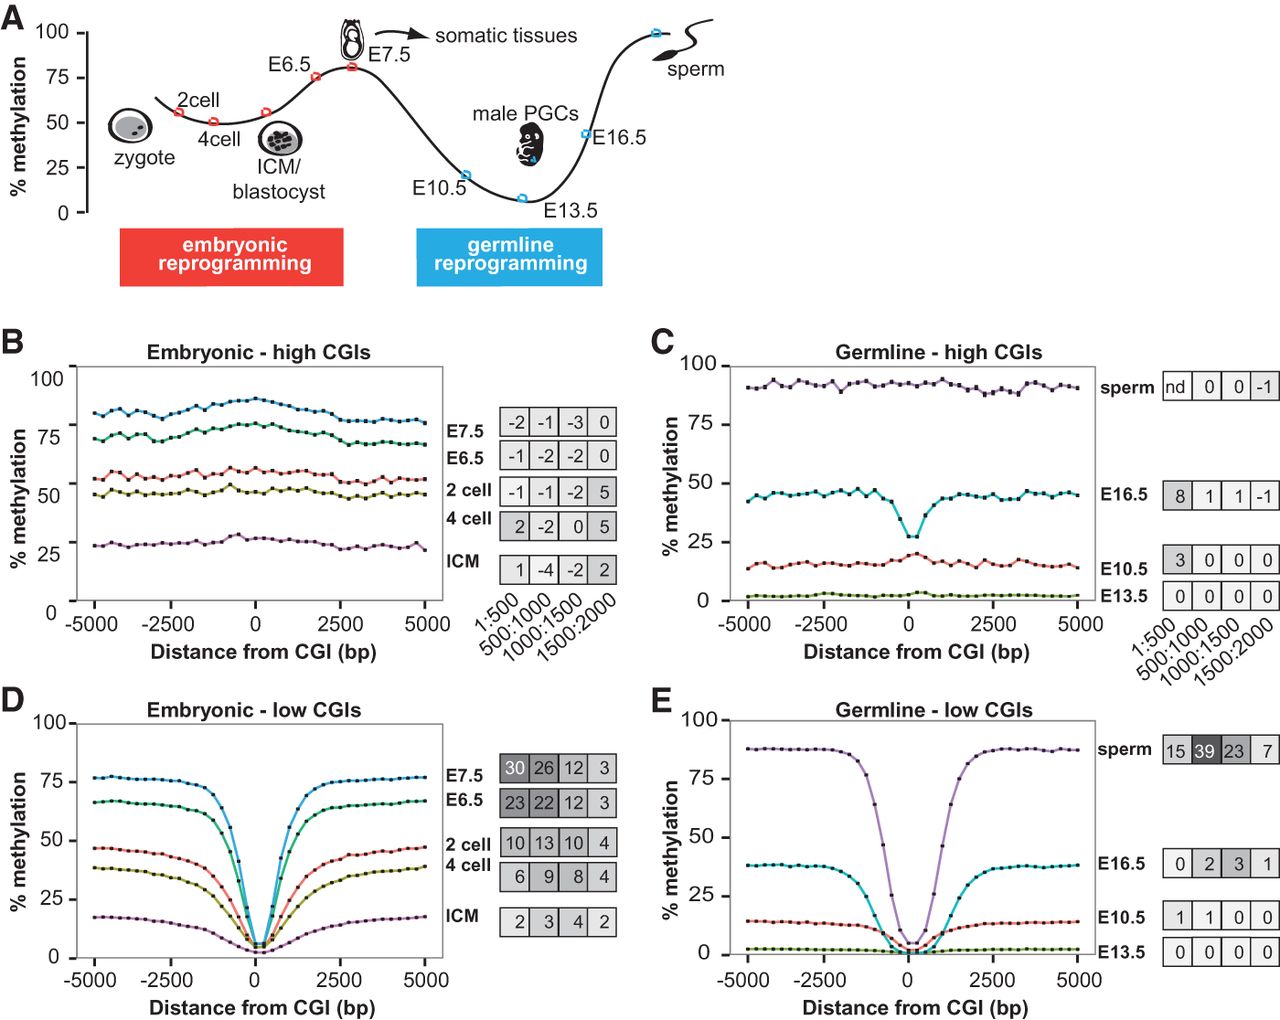
Sloping shore dynamics distinguish future-low and future-high CGIs during reprogramming. (A) Schematic of DNA methylation reprogramming through embryogenesis and germ cell development in the mouse. Colored dots represent time points that were analyzed in this study—red for embryonic and light blue for germ cells. (B) Methylation dynamics of future-high CGIs during embryonic development. High and low CGIs were defined based on their methylation status at E7.5 and traced through development. The developmental time point is labeled to the right of the line. Error bars represent standard errors of the mean (error bar heights may not be visible due to large sample sizes). Slopes at different intervals are depicted in a heat map to the right of the plot. (C) Methylation dynamics of future-high CGIs during germ cell reprogramming. High and low CGIs were defined based on their methylation status in sperm. (D) Methylation dynamics of future-low CGIs during embryonic reprogramming. (E) Methylation dynamics of future-low CGIs during germ cell reprogramming.


