
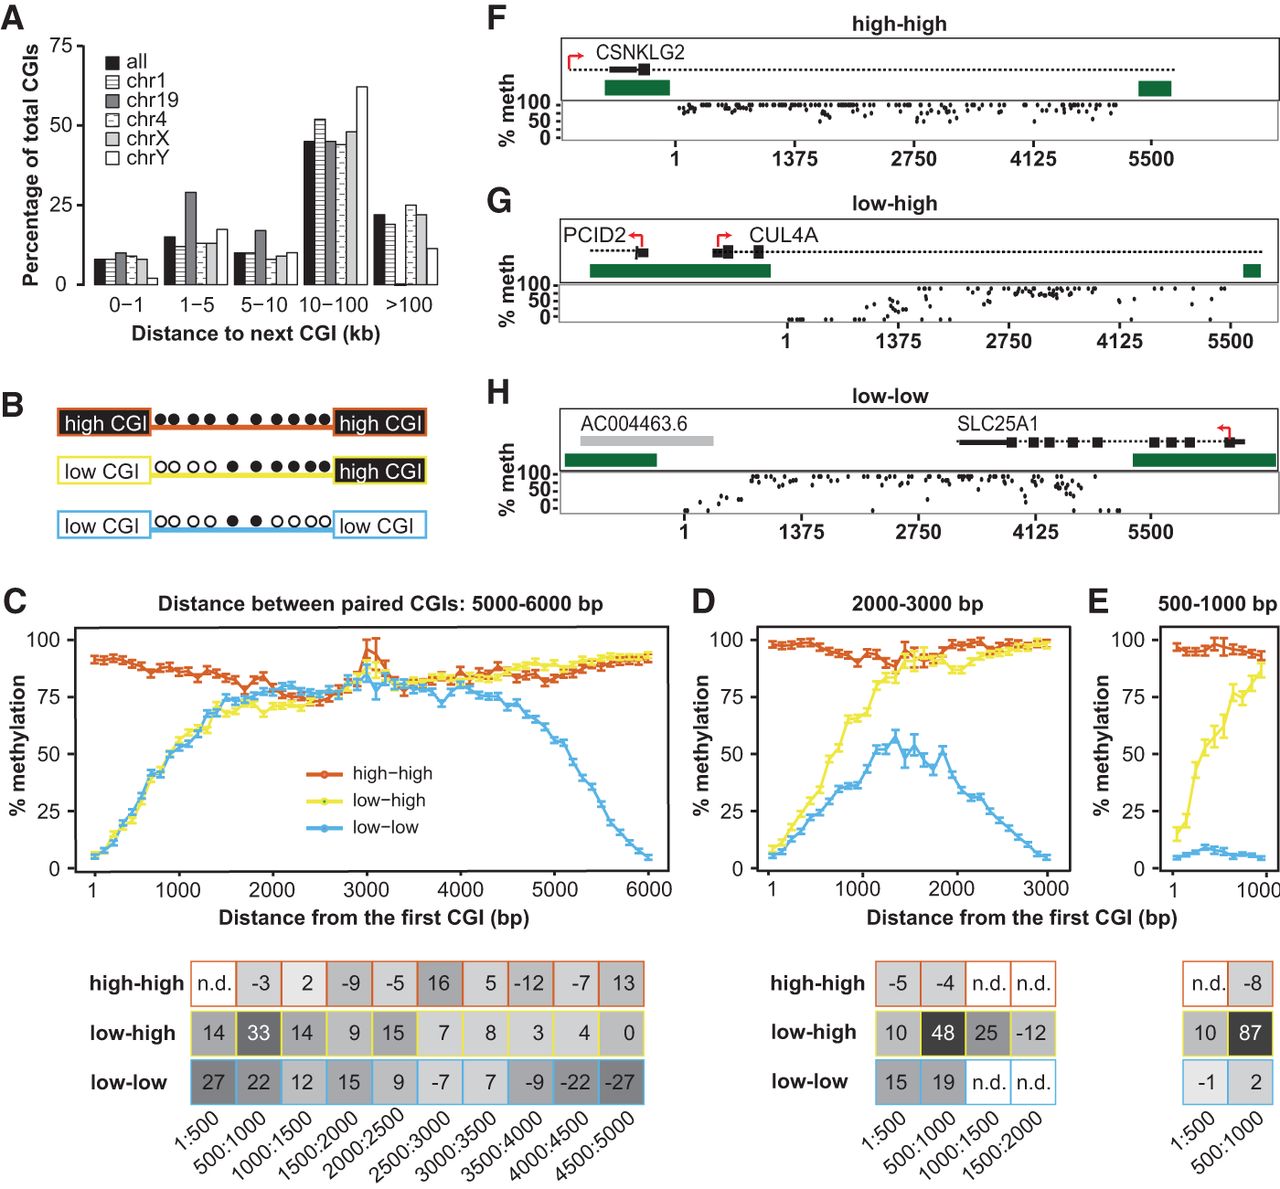
Neighboring CGIs influence shore slopes. (A) Percentage of CGIs that have a neighboring CGI within a given distance, either genome-wide or in selected chromosomes. (B) Schematic of possible pairs of CGIs: high-high, low-high, and low-low. Methylation status of CpGs between islands is indicated as filled (methylated) or open (unmethylated) circles. (C) Pairs of CGIs within 5000–6000 bp apart. Plot represents global average over 100-bp intervals. Error bars represent standard errors of the mean. The x-axis indicates distance of the CpG from the first CGI (on the left). Slope of the shore at various intervals is represented on the table below the plot. Points with n.d. did not have enough CpGs in the given interval to calculate a slope. Plots do not include CGI CpGs. (D) Pairs of CGIs within 2000–3000 bp apart. (E) Pairs of CGIs within 500–1000 bp apart. (F–H) Representative examples of CGI pairs in the genome for high-high (F), low-high (G), and low-low (H). Genomic context is pictured above each plot. Dark green blocks represent the CGIs. Red arrows indicate the direction of transcription. Black boxes and dashed lines denote annotated genes. Gray boxes denote annotated transcripts. Each dot represents one CpG. Plots do not include CpGs inside a CGI. The x-axis indicates distance from the CGI on the left.


