
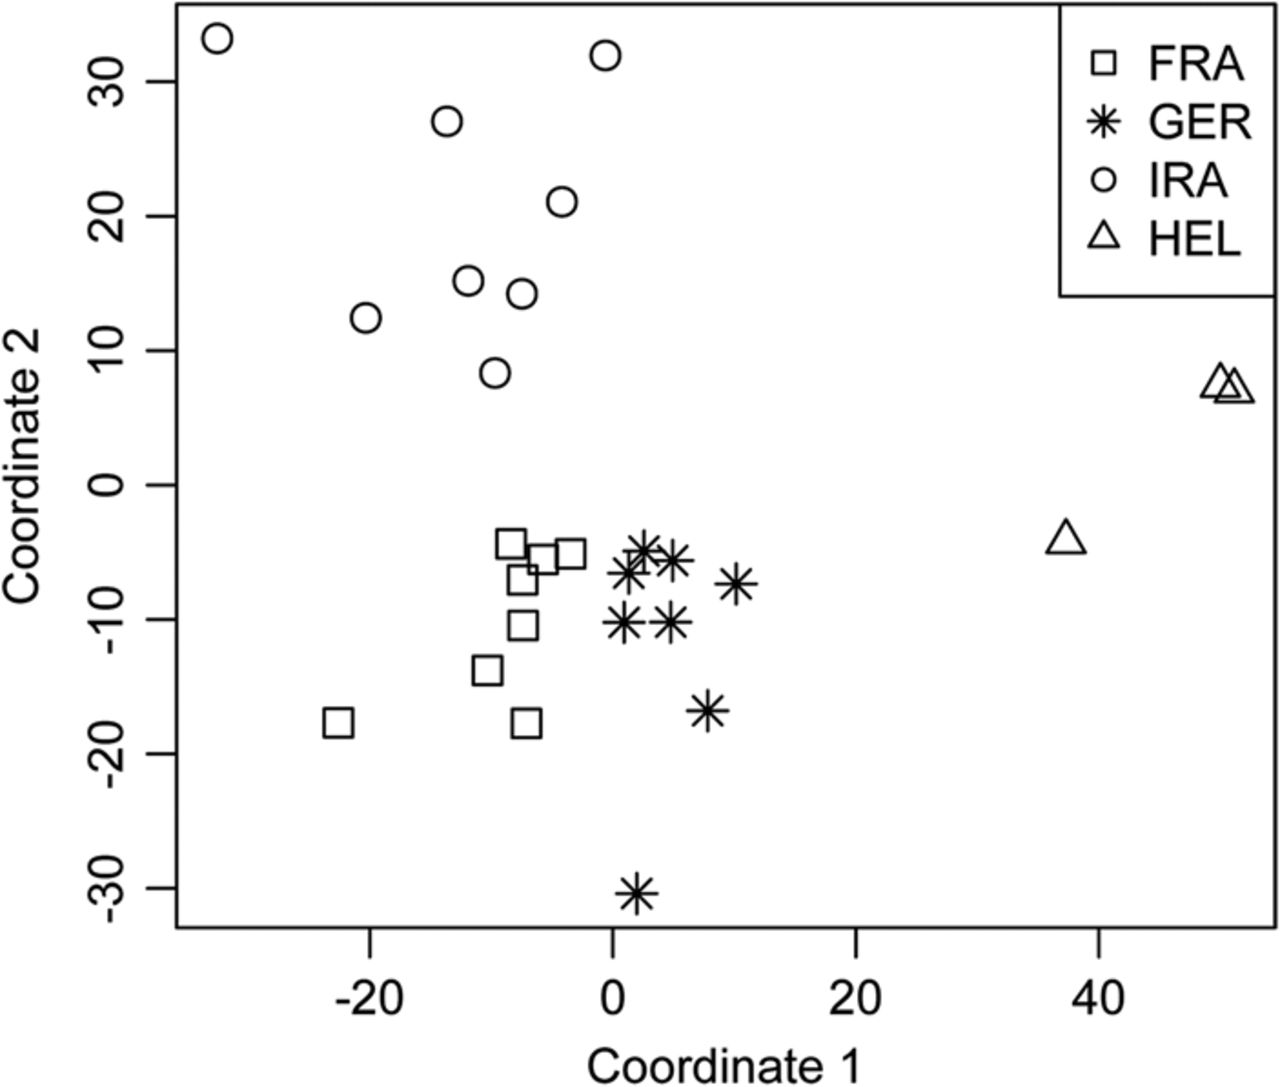
Figure 4.
Two-dimensional representation of nonmetric multidimensional scaling (MDS). The analysis is based on the dissimilarity matrix generated by calculating the Euclidian distance between each of the possible pairwise comparisons of 27 individuals across 1863 CNV genes. Each dot represents one individual.


