
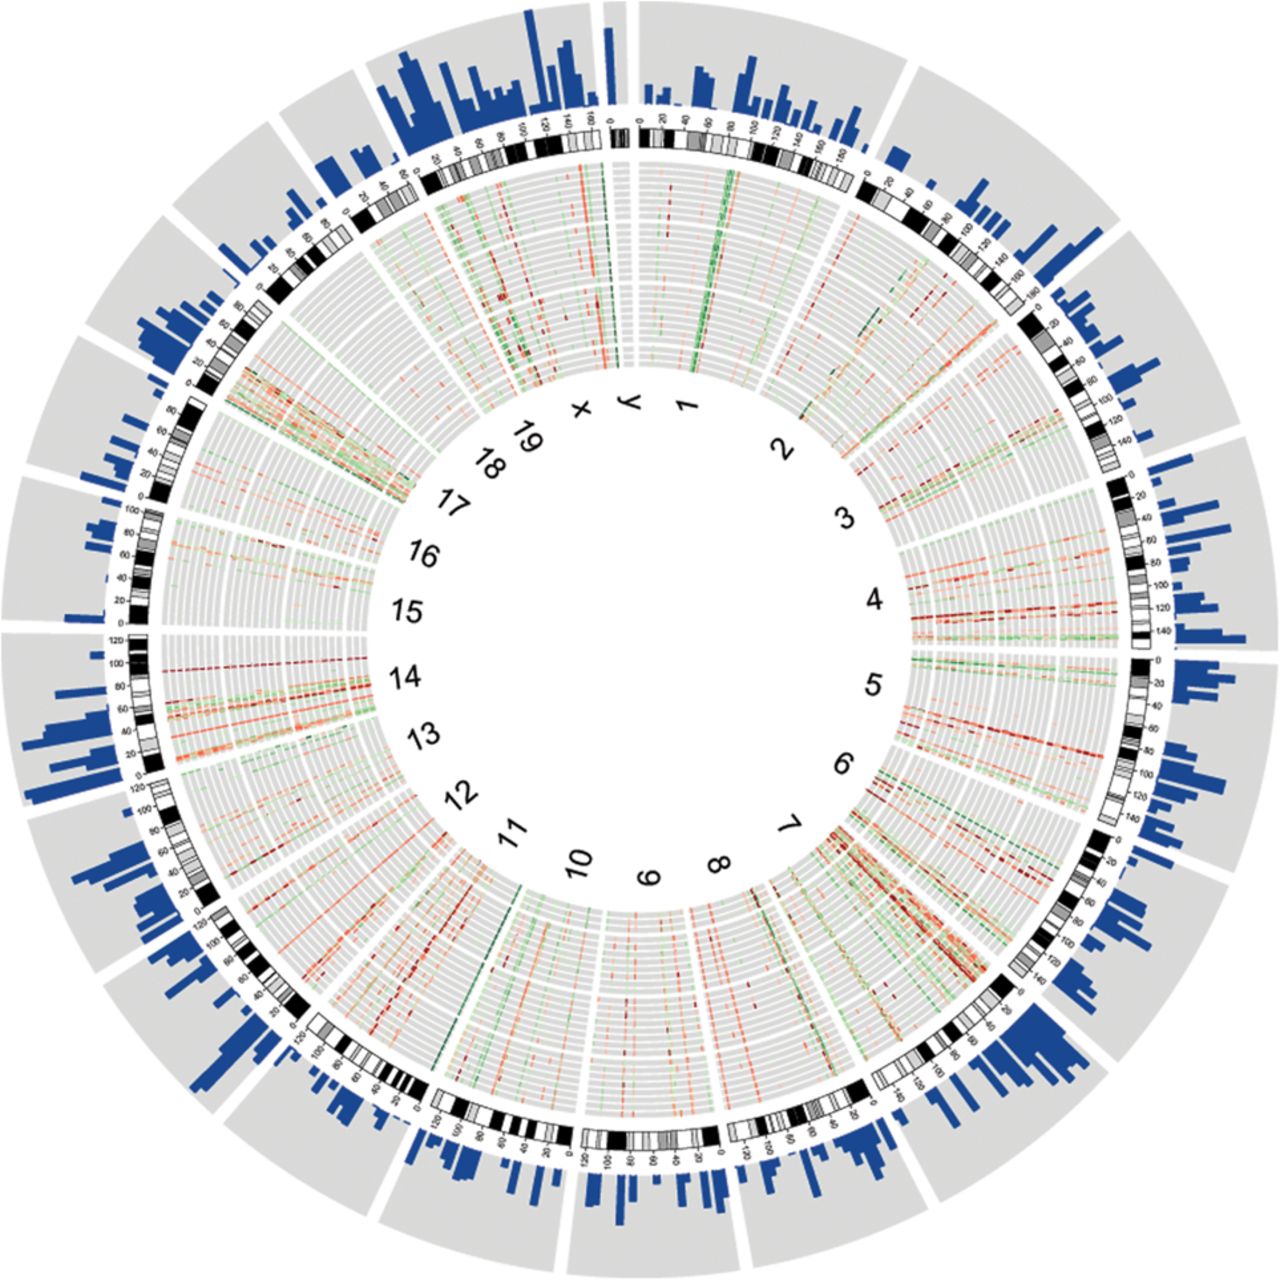
Figure 3.
Genome-wide distribution of CNV genes. CNV genes are represented in individual tracks as heat maps, where red bars depict deletions and green bars depict duplications with respect to the reference assembly. Darker shades illustrate higher degrees of copy number change. The data tracks are organized concentrically from the outer circle to the inner circle: histograms of SD (>10 kb) density per 5-Mb window (log2 scale); chromosome ideograms; eight individuals of each French, German, and Iranian population; three Heligoland mice; and chromosome numbers. The graph was plotted using Circos (Krzywinski et al. 2009).


