
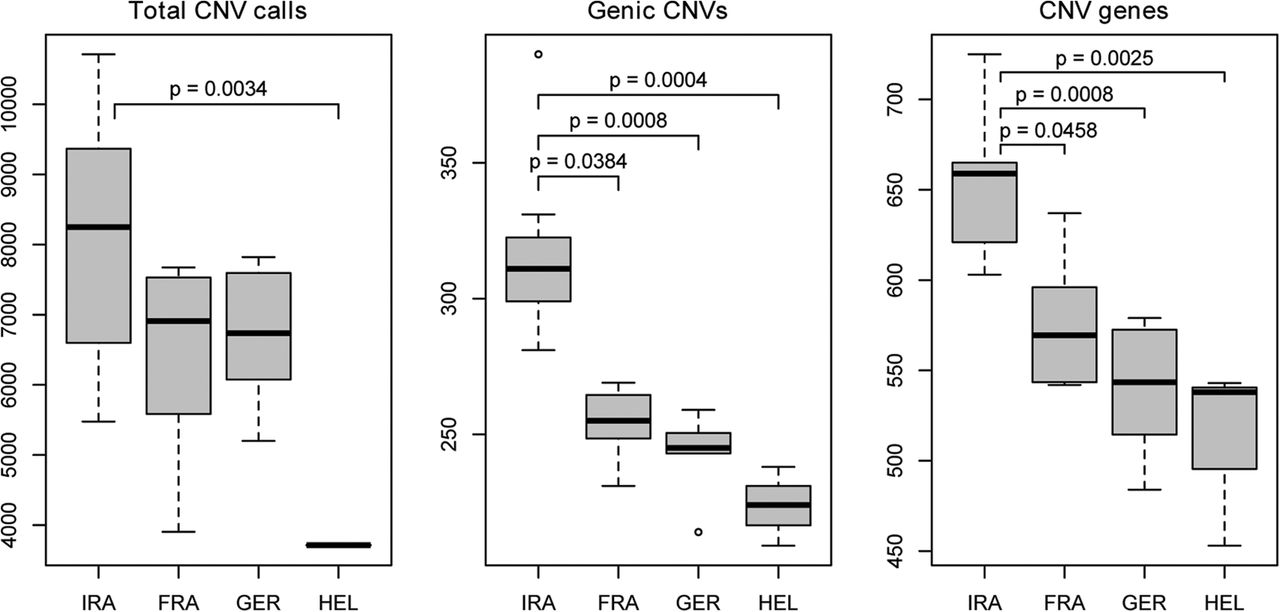
Figure 1.
Number of detected CNVs. Distribution of CNV count classes for each population. The median of the population is indicated by the central line in a box, while the edges of the box represent the first and third quartiles. The Kruskal-Wallis test, followed by Dunn's post hoc test, was used to determine which differences were significant. P values were adjusted for multiple comparisons using the Bonferroni correction and are indicated only for pairs with significant differences (P < 0.05).


