
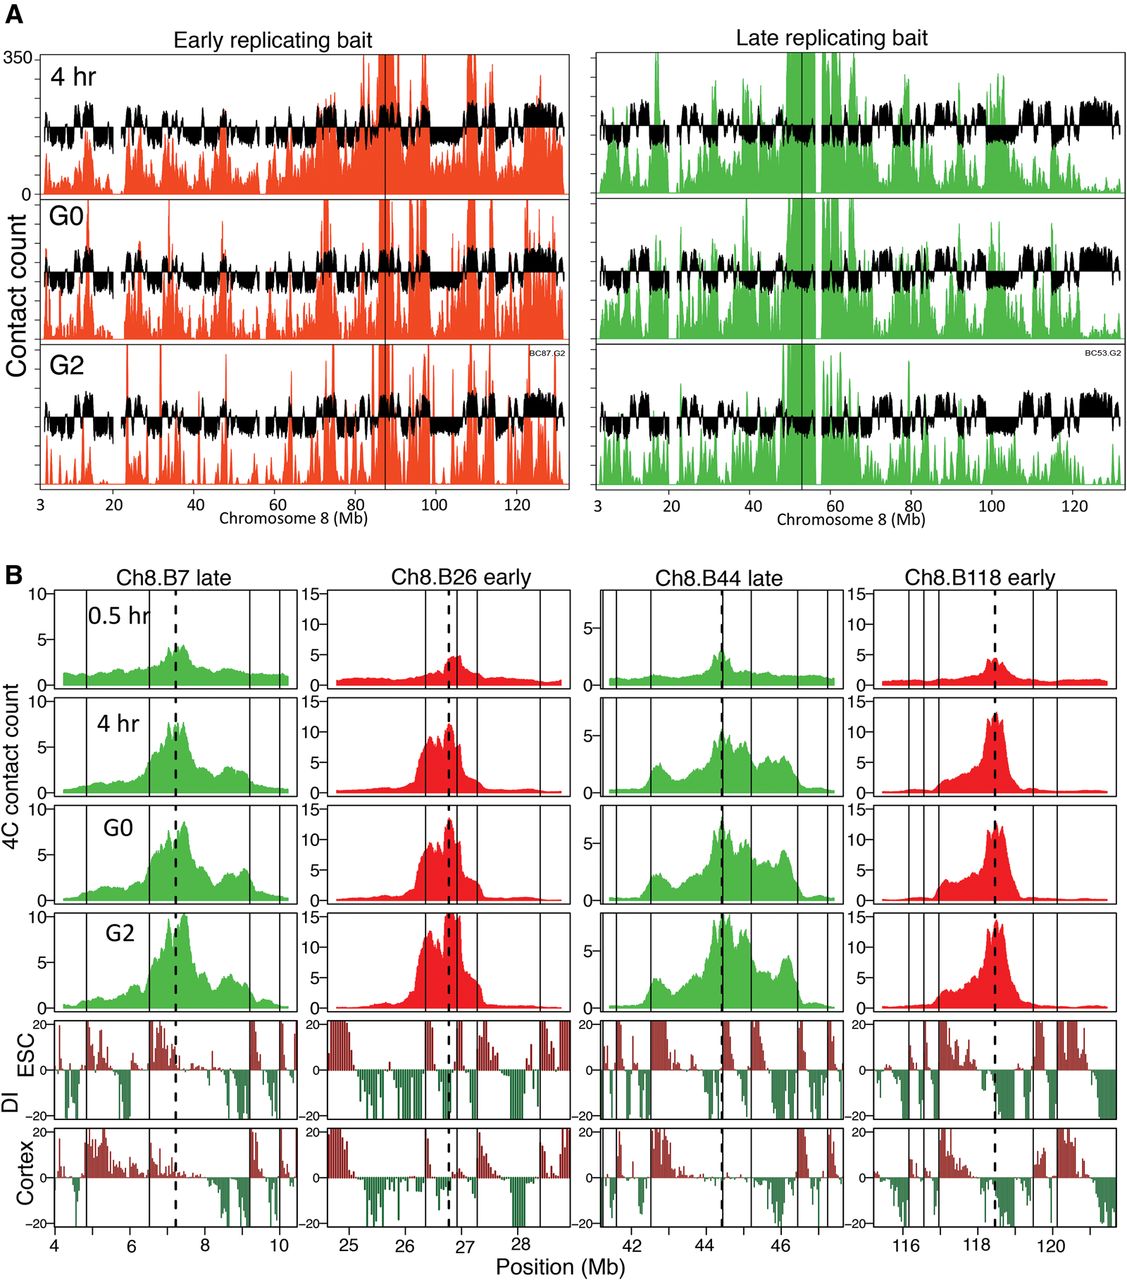
Figure 4.
Chromatin organization in G0 (quiescence) and G2 are similar to post-TDP. (A) 4C contact counts for an early (red) and late (green) replicating region, displayed as in Figure 2A, comparing 4-h interphase time point to G0 and G2. (B) 4C contact counts shown for 1 to 3 Mb to either side of early/late baits shows conserved TADs and directionality bias (as in Fig. 3A) during G0 and G2 phase, similar to the 4-h time point.


