
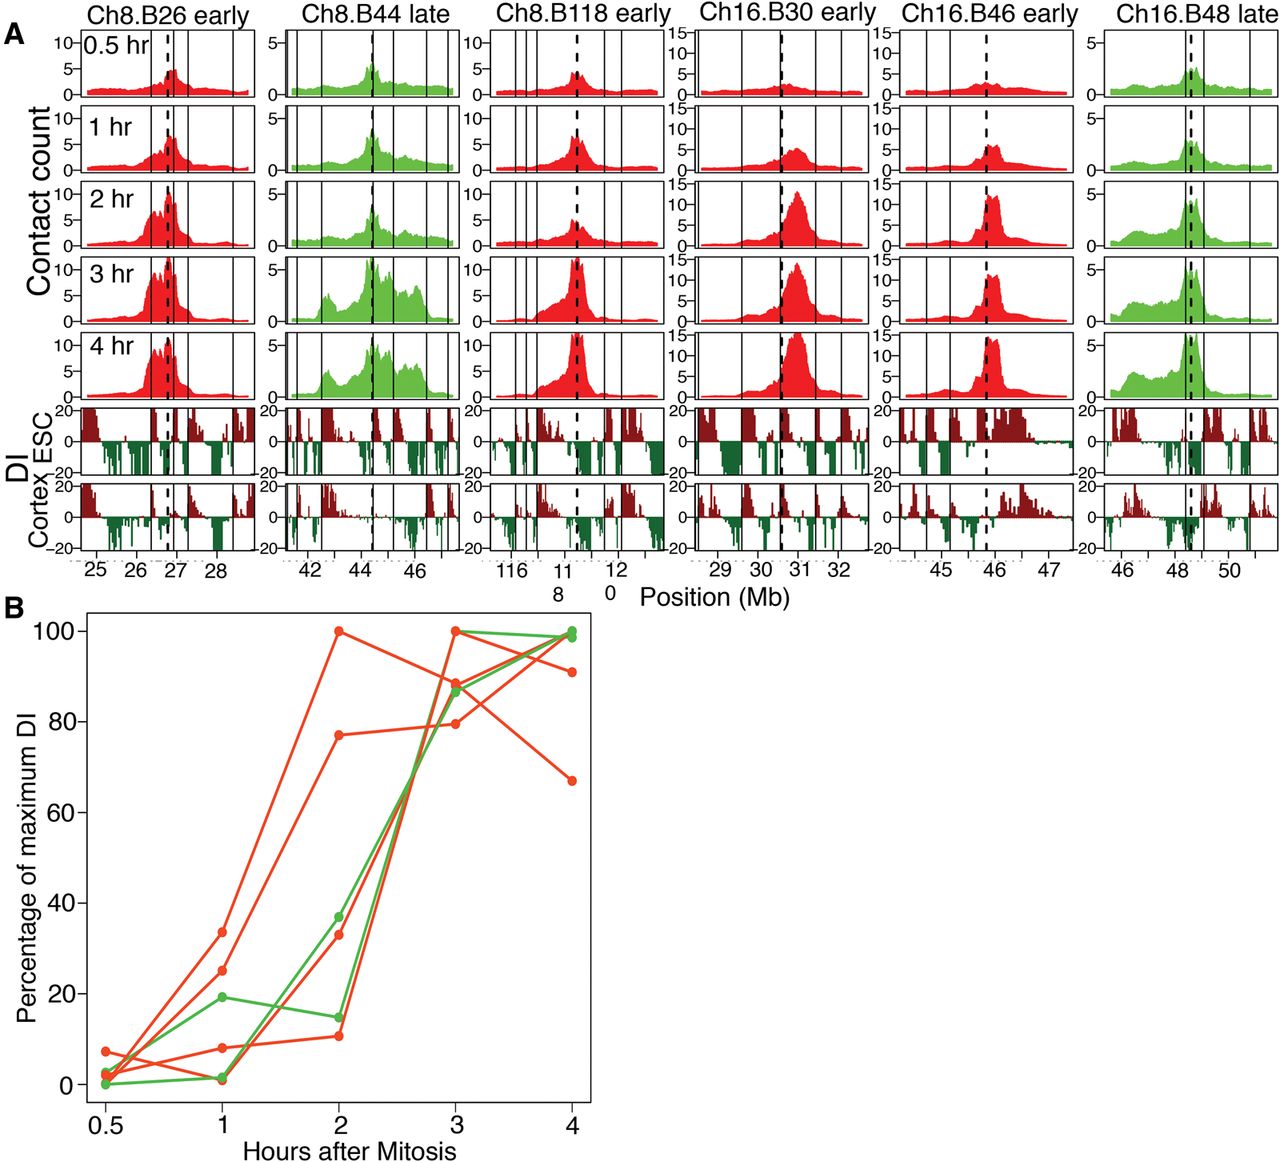
TADs are formed coincident with the TDP. (A) 4C contact counts shown for 1 to 3 Mb to either side of early/late baits. Below the contact count plots is the directionality index (DI) (Dixon et al. 2012) calculated from Hi-C in mouse ESC and cortex cell lines, shown to indicate the downstream (dark red) or upstream (dark green) bias. The vertical solid black line indicates TAD boundaries in mouse ESCs, and the dotted black line indicates the position of the bait. The kinetics of TAD formation can be visualized by the appearance of a sharp drop in contact frequency at RD/TAD boundaries. (B) Formation of TADs measured as an increase in directionality bias of the contacts with time, for baits positioned at constitutive early (red) and late (green) RDs (Ch8.B26, Ch8.B44, Ch8.B118, Ch16.B30, Ch16.B46, Ch16.B48). The y-axis shows the percentage of DI relative to the maximum DI for each bait.


