
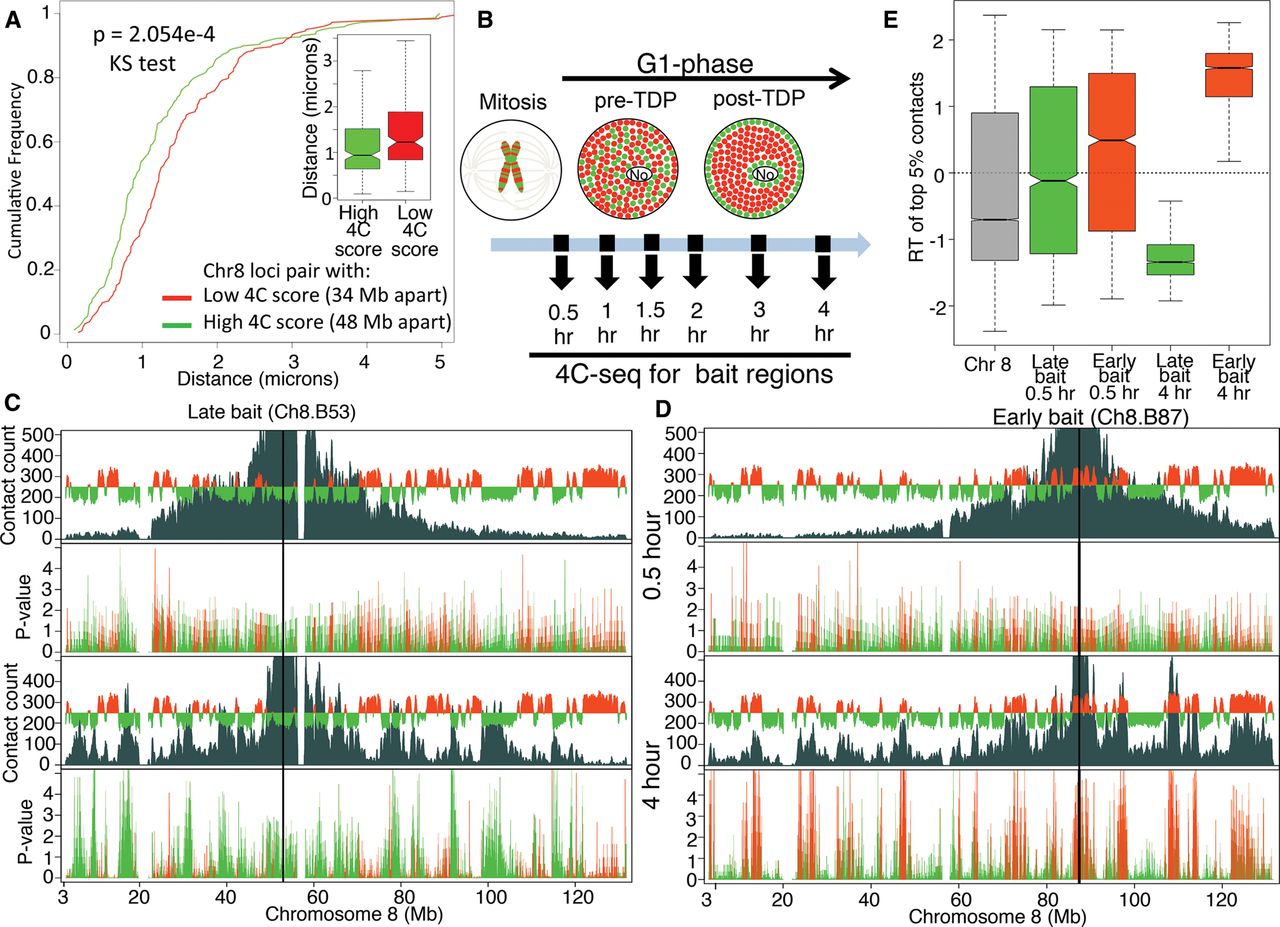
Establishment of interphase chromatin compartments during early G1. (A) Validation of 4C by 3D FISH. Cumulative frequency curves and box plots of distances (in microns) between FISH signals from a pair of regions with low 4C contact count (red, n = 51) or high 4C contact count (green, n = 57). (B) Schematic diagram of spatial distribution of early (red) and late (green) RDs within the nucleus before and after the establishment of a replication-timing program at the TDP in mouse C127 cells. Time points chosen for 4C after release from mitosis are indicated with black arrows. (No) Nucleolus. (C,D) “Contact count”: smoothed 4C data (dark gray) overlaid with the replication timing (RT) profile (red/green is early/late replicating) for a late replicating bait Ch8.B53 (C) and an early replicating bait Ch8.B87 (D). Both baits were analyzed at 0.5 h (top) and 4 h (bottom) after mitosis. “P-value”: negative log10 of contact P-values (Methods) colored in red or green for early or late replicating regions, respectively. Between 0.5 and 4 h after mitosis, contacts between bait and other intra-chromosomal regions become more significant and focused to those with similar RT as the bait. (E) Distribution of replication timing (RT) values for the strongest (top 5% highest z-scores) contacts with either the early replicating (Ch8.B87, red) or the late replicating (Ch8.B53, green) bait. Positive values of RT indicate early replication, negative values of RT indicate late replication, and zero indicates middle replication. The higher the magnitude the earlier or later the region replicates. For reference, the RT distribution of the whole Chr 8 is shown in gray. Contacts at 0.5 h did not have statistical significance, whereas 4 h had significant contacts to regions with the same RT as the bait (Supplemental Fig. 7A).


