
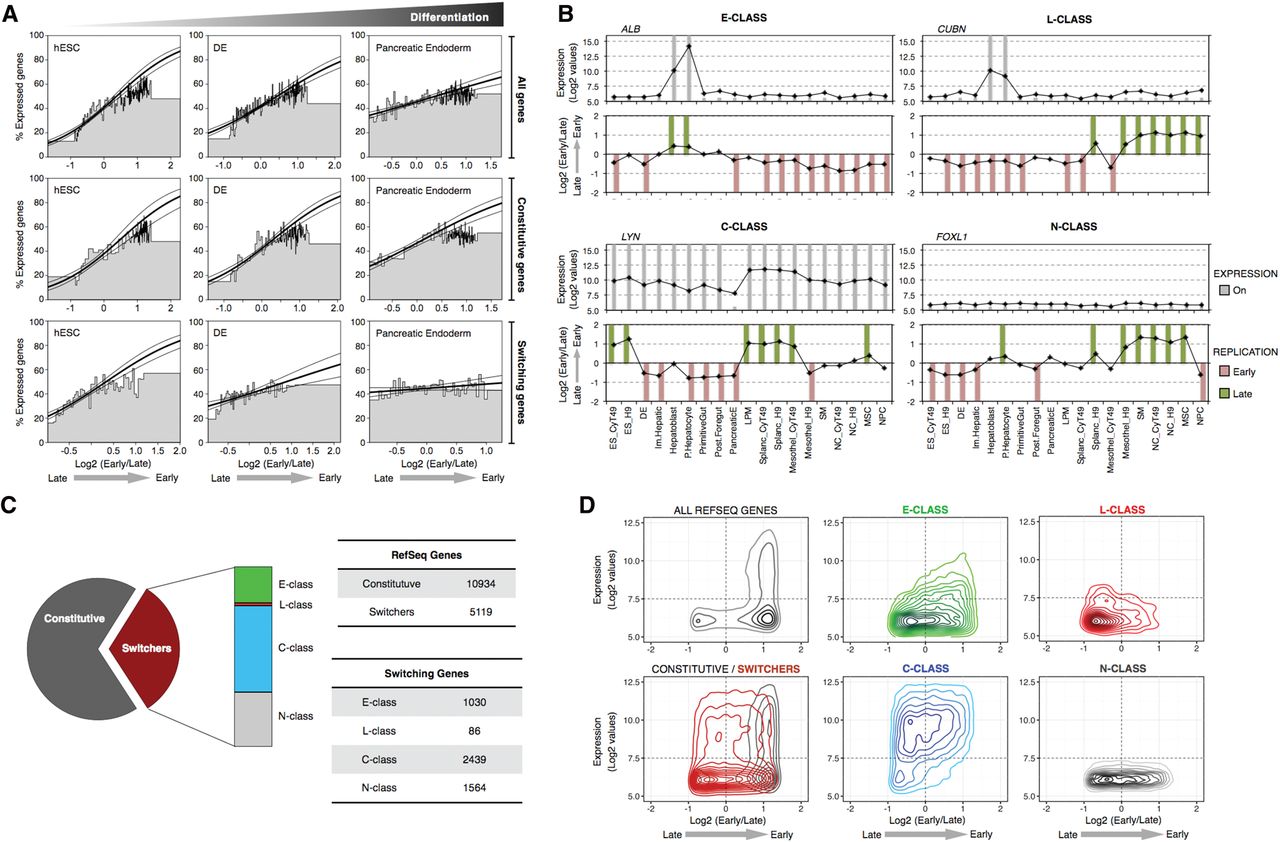
Switching genes and transcriptional regulation. (A) Correlation between early replication and the probability of expression changes during differentiation. Genes were scored as either expressed or not expressed and ranked by their RT ratio and divided into bins of 100 genes, the height of which represents the percentage of expressed genes within each bin. Logistic regression (inner line) and 95% confidence intervals (outer lines) reveal the correlation strength. Top row graphs include all genes, the middle includes only the RT-constitutive genes (i.e., do not change RT), and the bottom row includes only the genes that change RT during differentiation from hESC to pancreatic endoderm. (B) Distinct classes of switching genes. Transcriptional activity (top graphs) and RT (bottom graphs) of exemplary genes representing the distinct kind of switching classes: E-class genes are only expressed when early replicating (ALB); L-class genes can be expressed only when late replicating (CUBN); C-class genes can be transcribed whether early or late replicating (LYN); and N-class are genes with no transcriptional activity detected in the cell types profiled (FOXL1). Gray columns show the “On” calls for gene expression, and green/red columns show the early/late calls for RT according to the established thresholds (see Methods). (C) Frequencies of the distinct kind of genes based on their RT dynamics during differentiation. RT-constitutive genes were classified as O-class. (D) Density plots of all RefSeq genes, RT-constitutive and RT-switching genes, and the distinct categories of RT-switching genes according to their RT and transcriptional level.


