
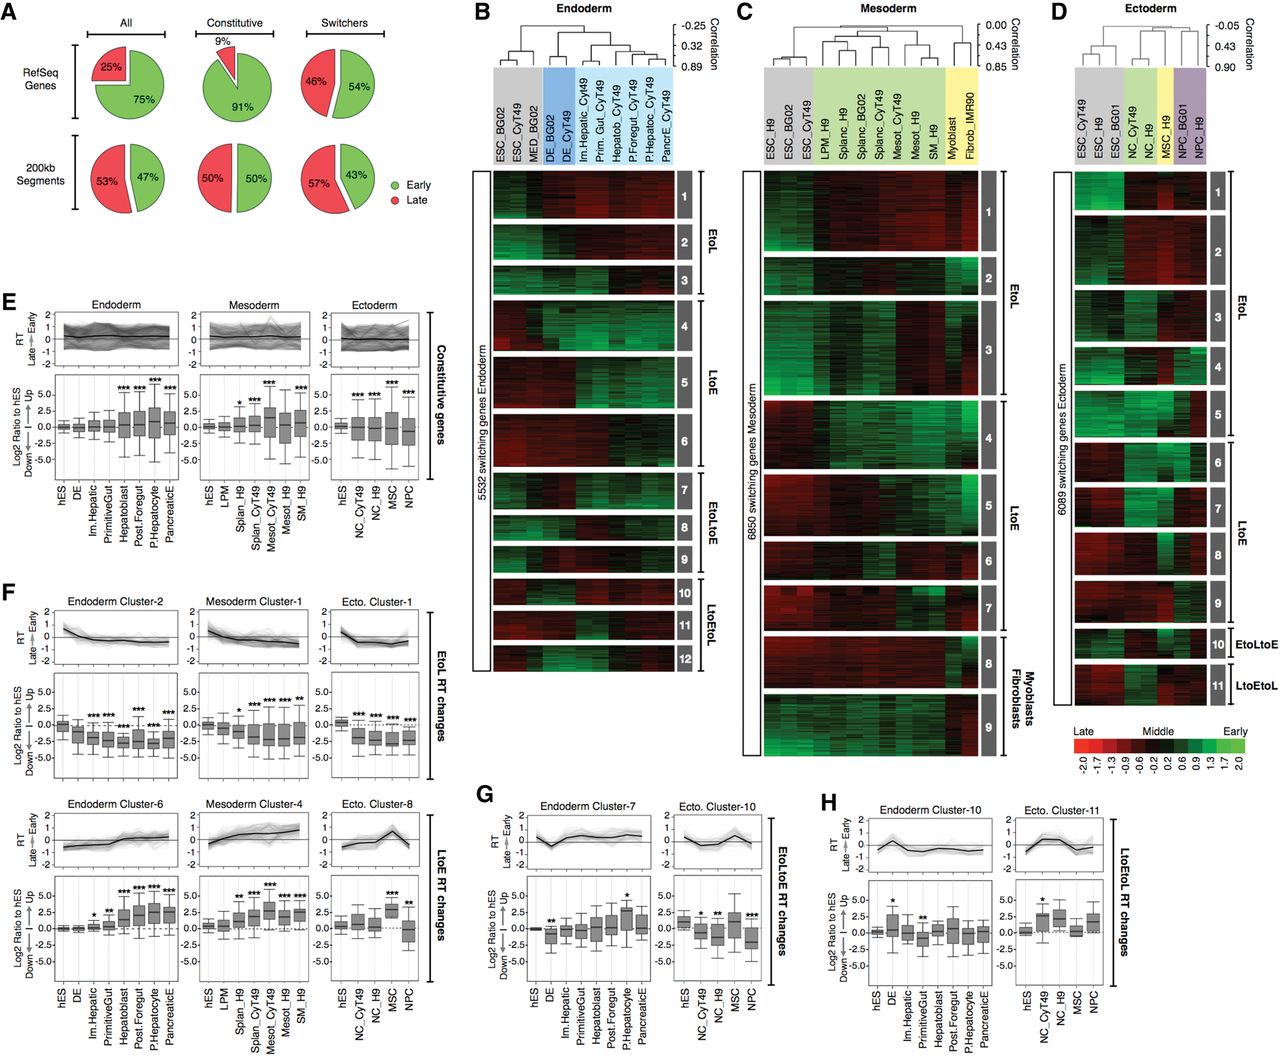
Dynamic changes in RT and transcriptional activity during hESC differentiation. (A) Frequency distributions of 200-kb segments and RefSeq genes in early and late S-phase fractions. The first row includes a pool of 200-kb or RefSeq genes (All) across all cell types; the second row includes only the RT-constitutive regions (i.e., does change RT in any cell type); and the third row includes only the regions or genes switching RT at least in one cell type. RT changes during hESC differentiation toward endoderm (B), mesoderm (C), and ectoderm (D). Averaged RT values at the TSS of 27,544 RefSeq genes were obtained; the switching genes were extracted according to the same criteria of Figure 1 and analyzed by hierarchical clustering and k-means. The heat map shows the RT ratios [=log2(Early/Late)]. Branches of the dendrogram were constructed based on the correlation values (distance = correlation value −1), and distinct correlation thresholds were used to color label the major nodes. The sex chromosomes were removed from the analysis to discard gender differences. The k-means clusters are shown as numbered gray boxes. (E–H) Transcriptional regulation and its relationship with RT dynamics for RT-constitutive genes (E), genes switching EtoL and LtoE (F), EtoLtoE (G), and LtoEtoL (H). Note that in E, some genes appear to switch RT but do not meet the RT-switching cutoff used in this study. (F–H) Genes with a fold difference ≥6 in expression level compared with hESC at any differentiation stage were classified into the RT clusters from panels B to D to identify the kinetics of regulation. Line graphs depict the dynamics in RT of each cluster, and box plots were used to display the transcriptional ratios against expression in hESC: (*) P ≤ 0.05; (**) P ≤ 0.01; (***) P ≤ 0.001 compared to hESC.


