
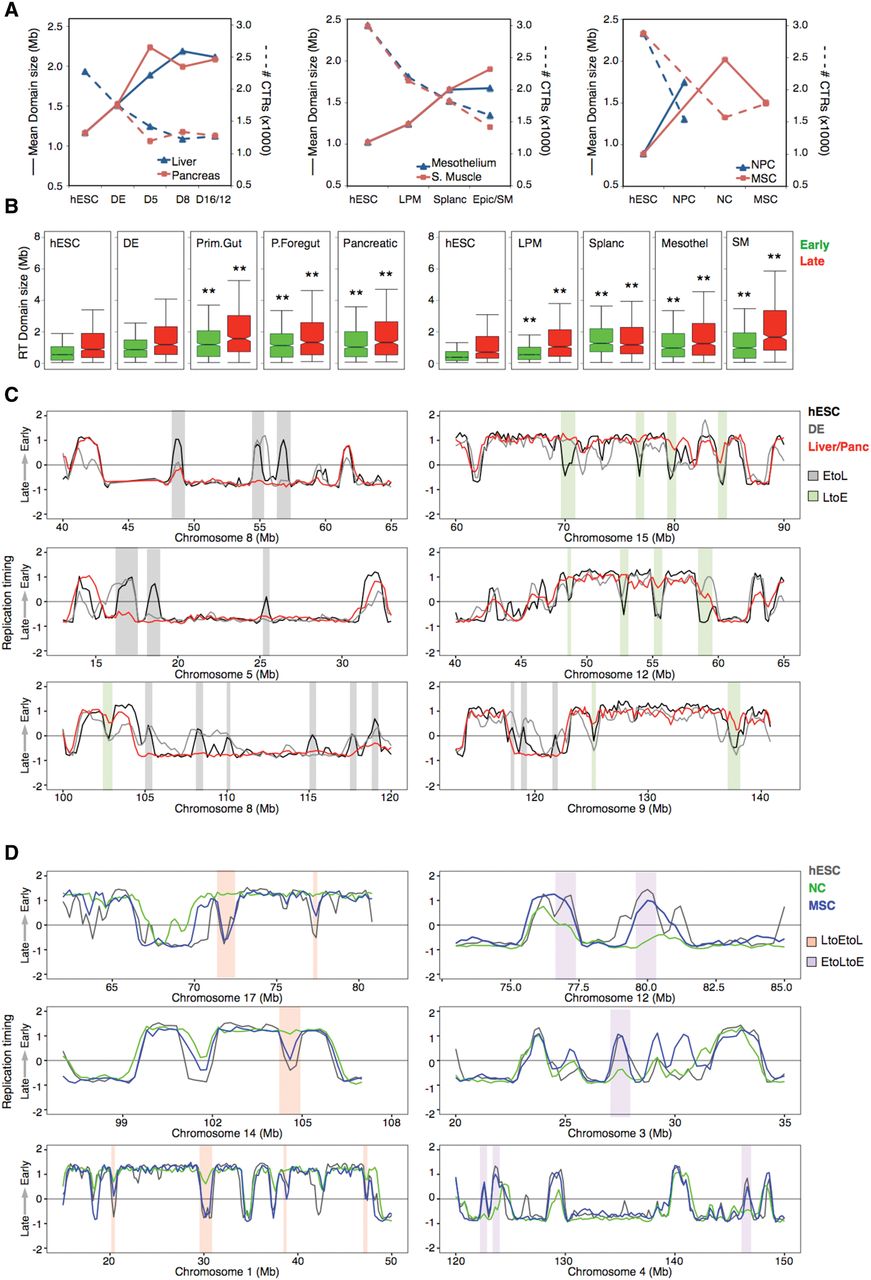
Figure 3.
Replication domain (RD) reorganization during hESC differentiation. (A) Number and sizes of constant timing regions (CTRs) in the distinct pathways. Solid lines depict the average size of the CTRs, whereas dashed lines depict the total number of CTRs in each cell type. (B) Sizes of early and late replicating CTRs during differentiation toward pancreas, mesothelium, and smooth muscle: (**) P ≤ 0.01 compared to hESC. (C) Representative RD consolidation during hESC differentiation. (D) Deconsolidation of RD during MSC differentiation.


