
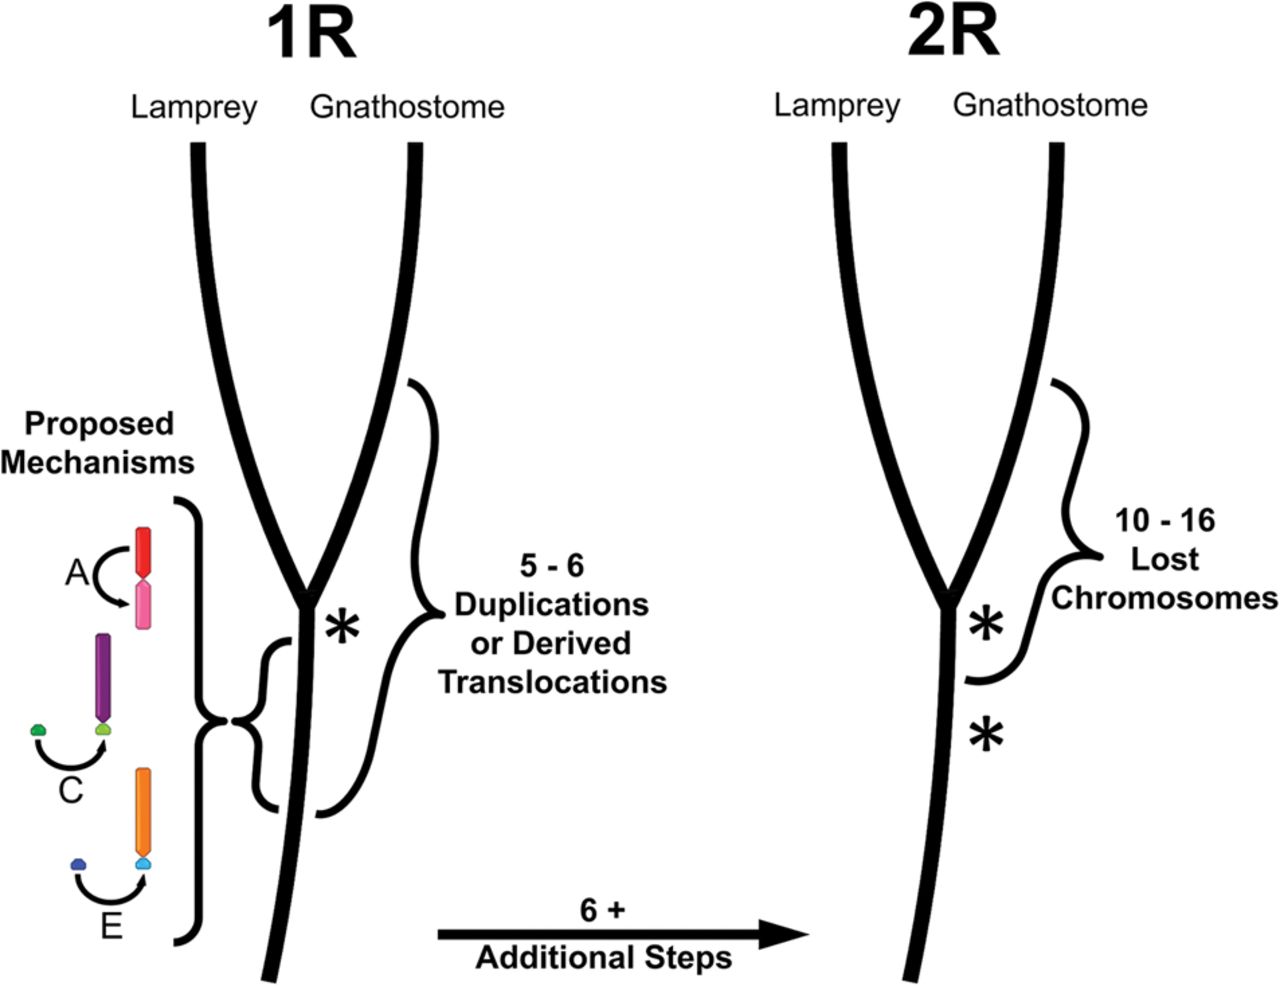
Figure 6.
A summary of alternate evolutionary models explaining the distribution of paralogous segments in gnathostome genomes. Asterisks denote whole-genome duplication events proposed under two alternate sets of evolutionary models. Mechanisms underlying three pre-R1 duplications are depicted under the “1R” model.


