
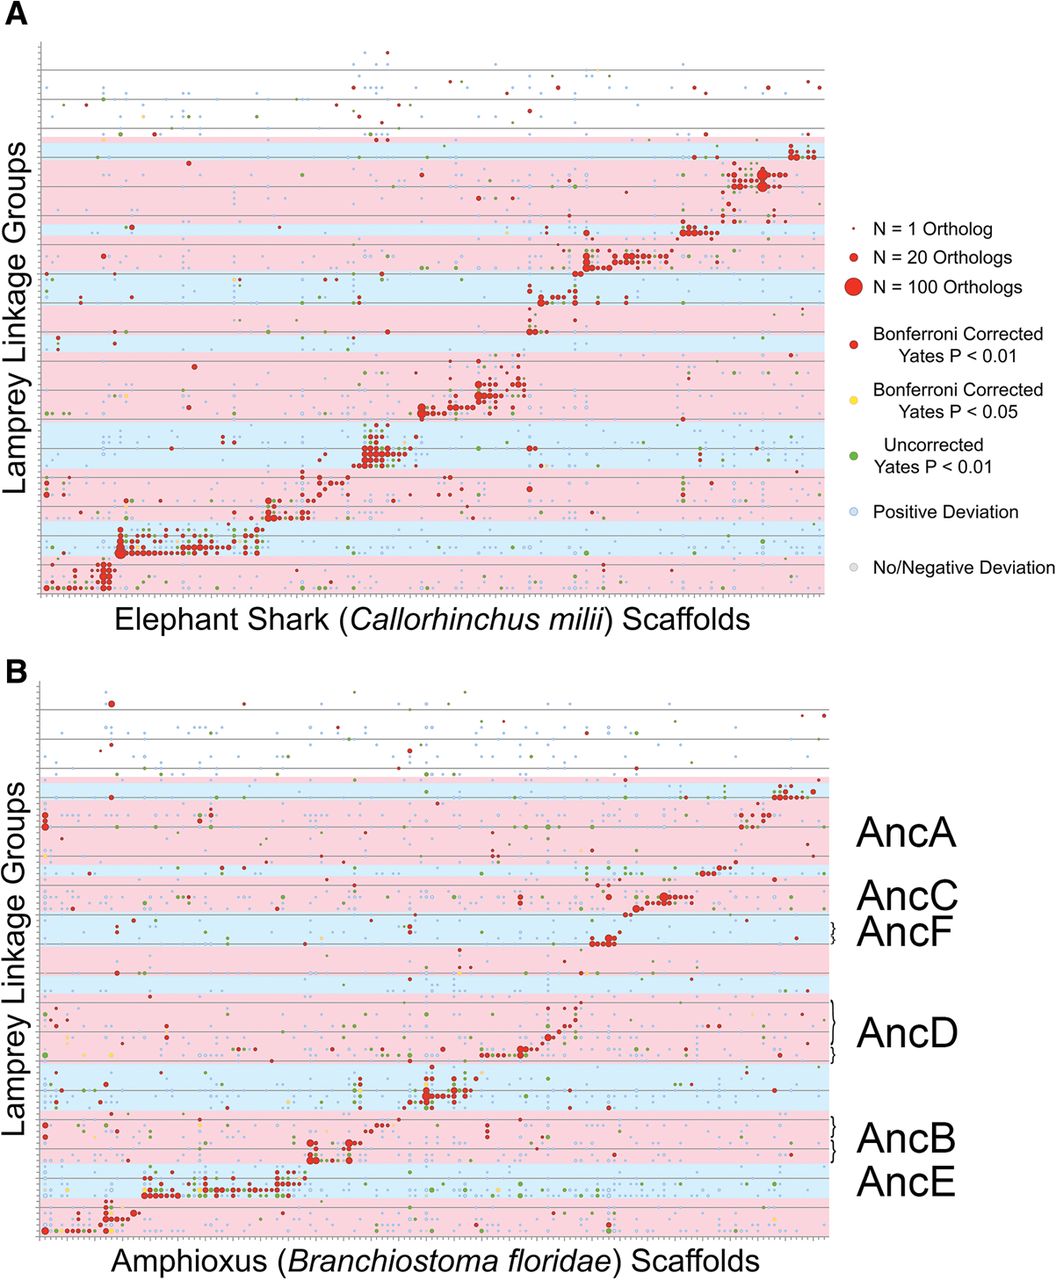
Comparative mapping with amphioxus and elephant shark reveals conserved syntenic segments that provide additional support for the proposed set of ancestral (pre-duplication) chromosomes. (A) The distribution of orthologs across lamprey linkage groups and elephant shark scaffolds. (B) The distribution of orthologs across lamprey linkage groups and amphioxus scaffolds. Lamprey linkage groups are oriented along the y-axis and reference scaffolds are oriented along the x-axis. Circles reflect counts of syntenic orthologs on the corresponding linkage group and scaffold, with the size of each circle being proportional to the number of orthologous genes. The color of each circle represents the degree to which the number of observed orthologs deviates from null expectations under a uniform distribution across an identical number of LGs, chromosomes, and genes per LG and chromosome. Shaded regions of the plot designate homology groups that correspond to presumptive ancestral chromosomes, marked A–M (Supplemental Table S1). The ordering of lamprey LGs along the y-axis is identical to Figure 2 and is provided in Supplemental Table S4. Brackets in B denote discreet sets of orthologous segments that lend support to post-WGD rearrangements.


