
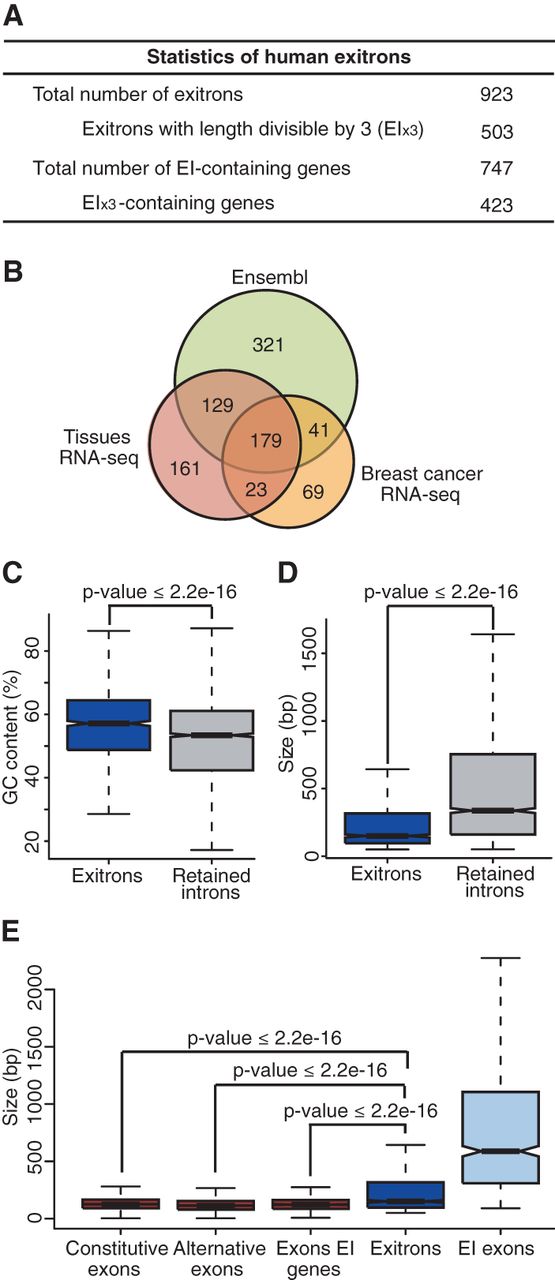
Figure 5.
Identification and characterization of human EIs. (A) General statistics of human EIs. (B) Venn diagram of EIs identified by different sources. (C,D) Comparisons of GC content (C) and size distributions (D) of EIs and IRs. (E) Comparison of size distributions of EIs and different types of exons. (C–E) Data presented as Tukey box plots.


