
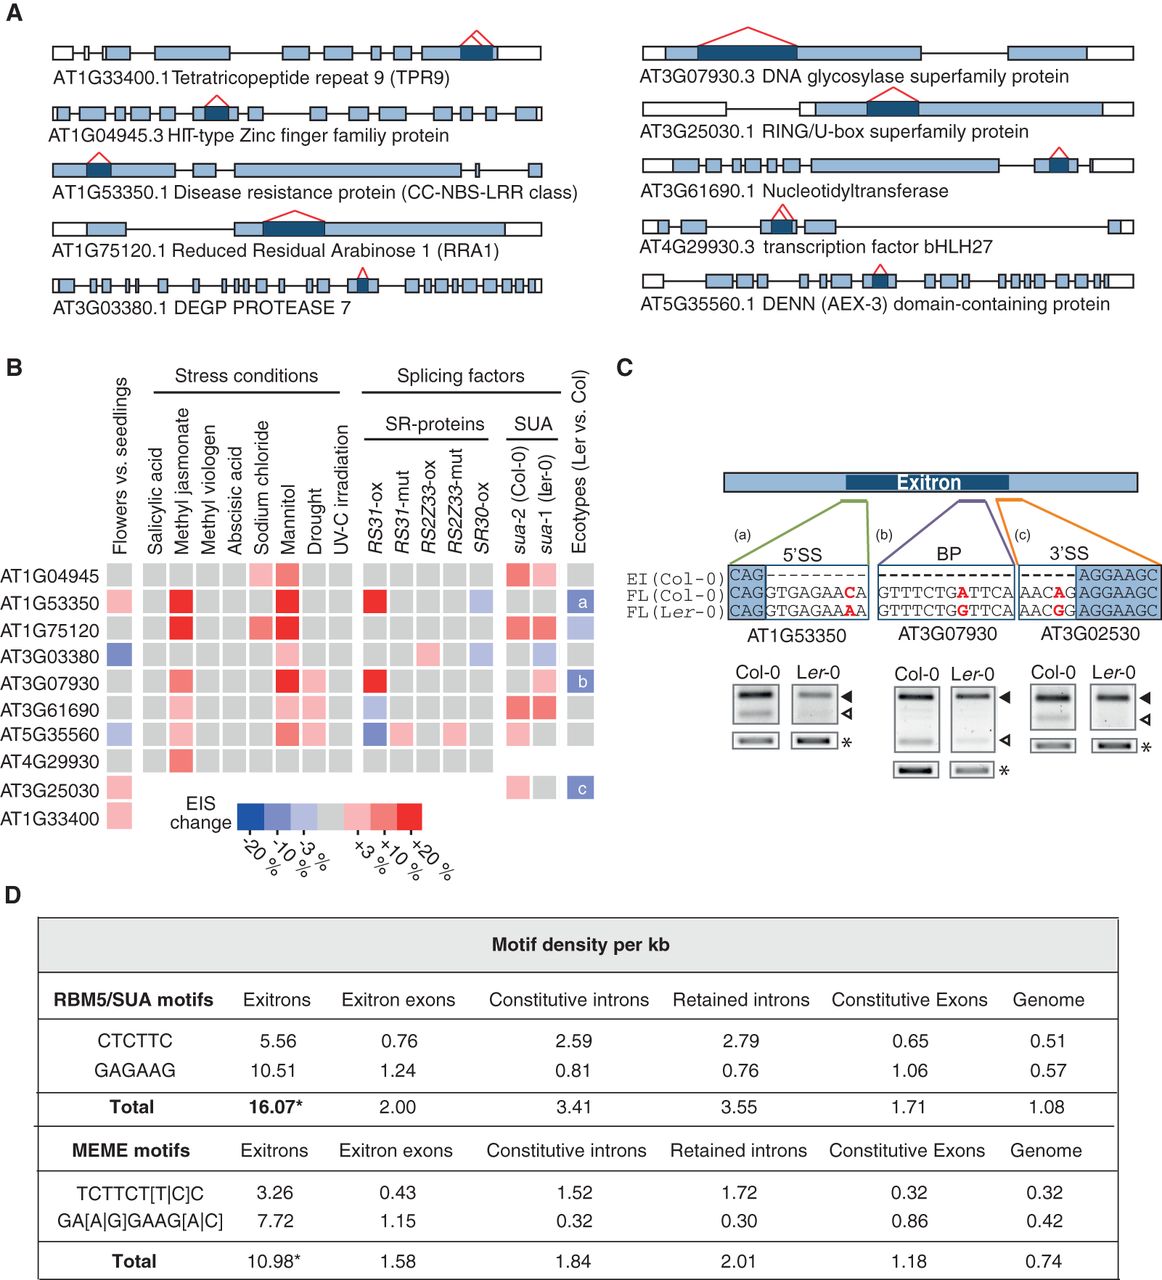
Regulation of exitron splicing in Arabidopsis. (A) Structures of EIx3-containing genes tested by RT-PCR in B. Dark blue indicates exitron; red carets, exitron splicing. (B) Heatmap for EIS in different tissues, stress conditions, splicing factor mutant and overexpression lines, and Col-0 and Ler-0 ecotypes. The coloring represents only significant changes (P-value ≤ 0.1). a, b, and c refer to cases described in C. (C) SNPs affect EIS in Ler-0 ecotype. SNPs in the splicing signals are indicated in red. 5′SS, 3′SS, and BP indicate 5′ splice site, 3′ splice site, and branch point, respectively. RT-PCR products of the full-length (FL) and EI-spliced isoforms (filled and open triangles, respectively) are shown. Ubiquitin was used as a loading control (*). (D) RBM5/SUA motifs and MEME-predicted motifs are enriched in exitrons ([*] P-value < 0.0001).


