
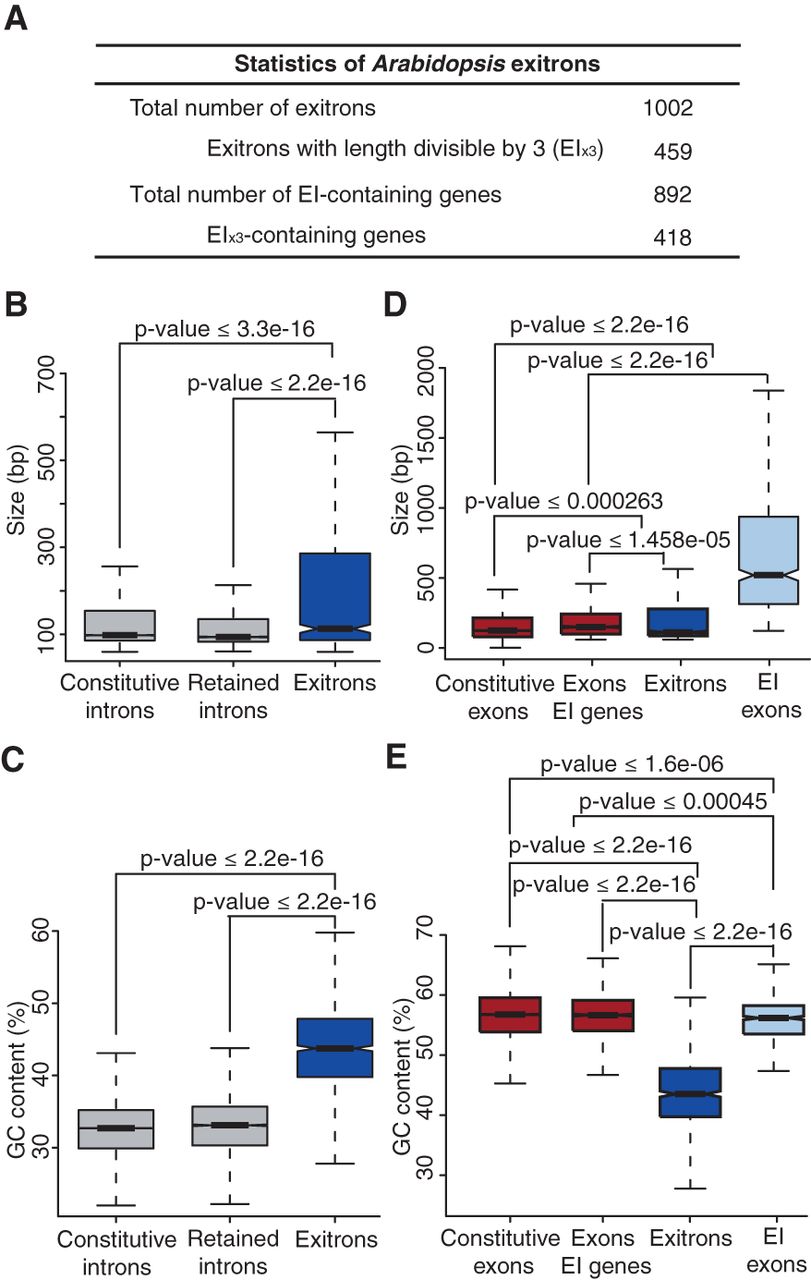
Figure 2.
Statistics and features of Arabidopsis EIs. (A) General statistics of Arabidopsis exitrons. (B,C) Comparisons of size distribution (B) and GC content (C) of exitrons and introns. (D,E) Comparisons of size distribution (D) and GC content (E) of exitrons and exons. (B–E) Data presented as Tukey box plots.


