
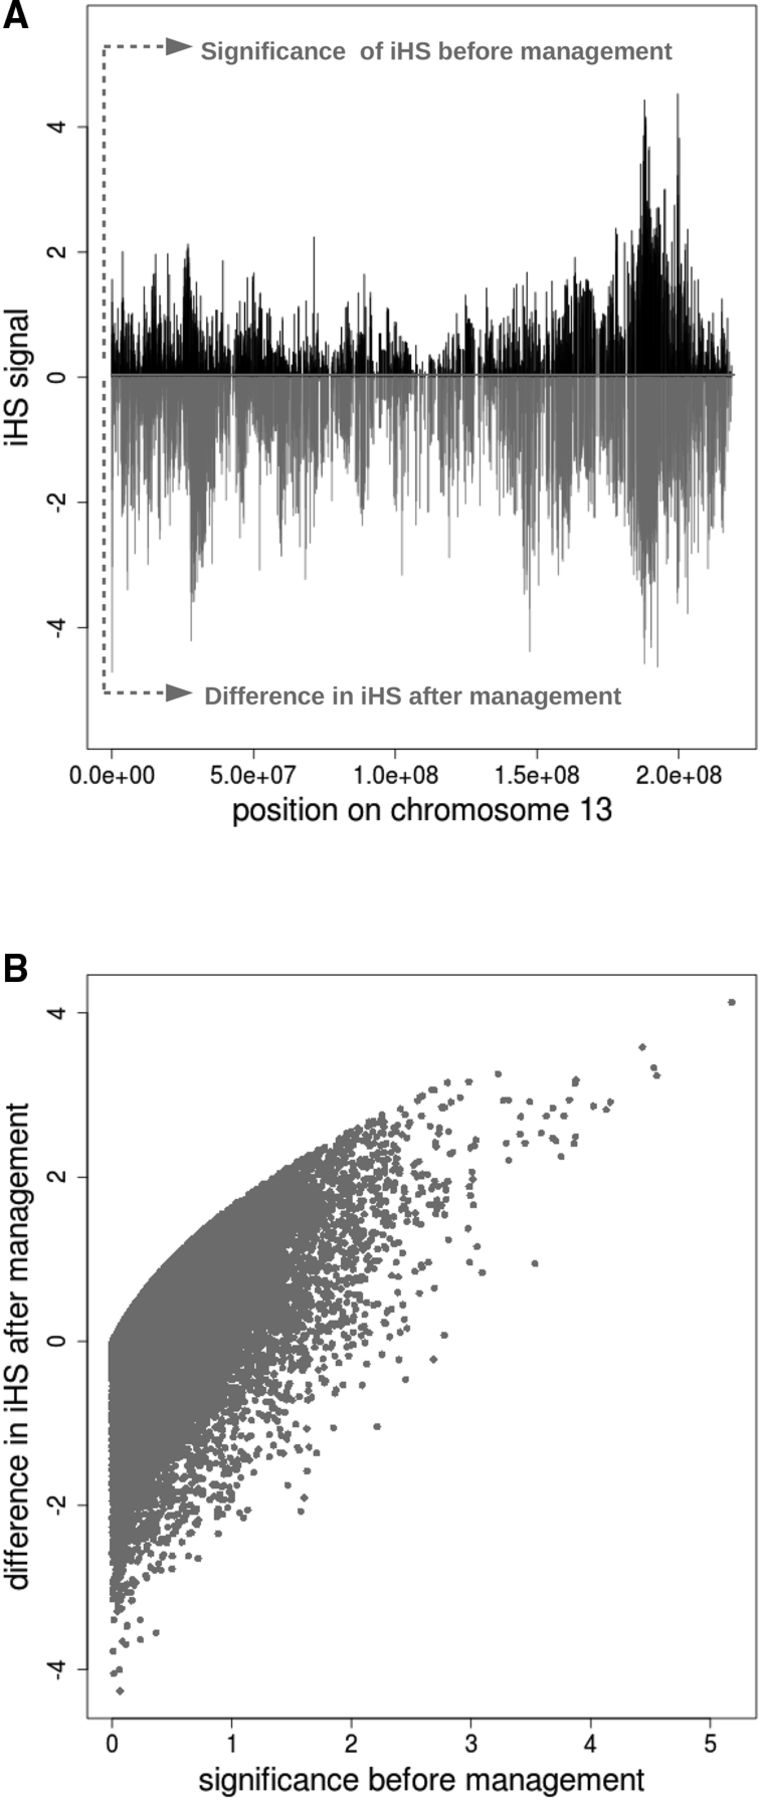
Change in selective sweeps in the Pietrain population. Signatures of selection are measured as extended haplotype homozygosity (iHS signal) in the Pietrain population before and after management. (A) Example of the effect of management on the selective sweep on Chromosome 13. The significance level of the iHS signal before management are indicated in black (−log(p), y-axis) and range between 0 and 4, so that markers with a signal greater than 2 are considered to be significant. Differences in iHS signal per marker before and after management are indicated in gray and range from 0 to −5, with a strong negative number indicating a large difference. (B) Genome-wide correlation between the significance level of the iHS signal before management (x-axis) and the strength in iHS signal per marker before and after management (y-axis). Negative values on the y-axis indicate a stronger signal in the population after management for the associated marker.


