
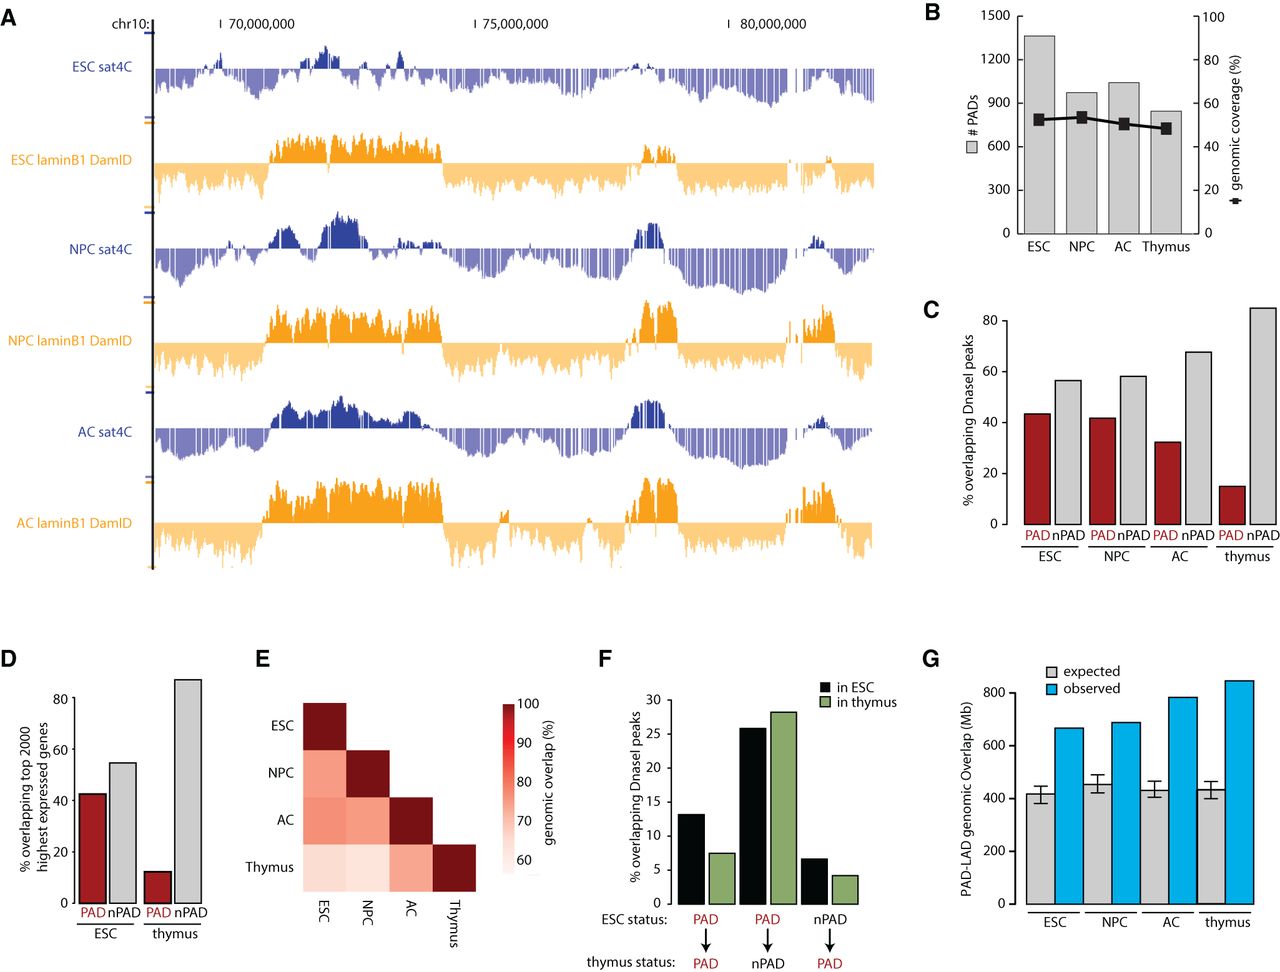
Segregation of inactive chromatin around chromocenters is established during lineage commitment. (A) Comparison of sat4C (blue) and Lamin B1 DamID (orange) profiles (taken from the UCSC Genome Browser) for the same genomic region in ESCs, NPCs, and ACs. (B) Histogram showing the number of PADs and the genomic coverage in each cell type. (C) Distribution of clusters of DNase I hypersensitive sites (hotspots) across PADs and non-PADs in each cell type. (D) Distribution of the top 2000 expressed genes across PADs and non-PADs in ESC and thymus. (E) Heatmap showing pairwise genomic PAD overlaps between all tissues examined as a percentage of PADs in the labeled tissues below the heatmap. (F) Comparison of DNase I hypersensitive sites in ESC and thymus for constitutive PADs, ESC-specific and thymus-specific PADs. (G) Histogram plot showing PAD-LAD overlap as genomic coverage (blue) and the 99% confidence intervals for expected overlap (gray with error bars) in each cell type based on randomization.


