
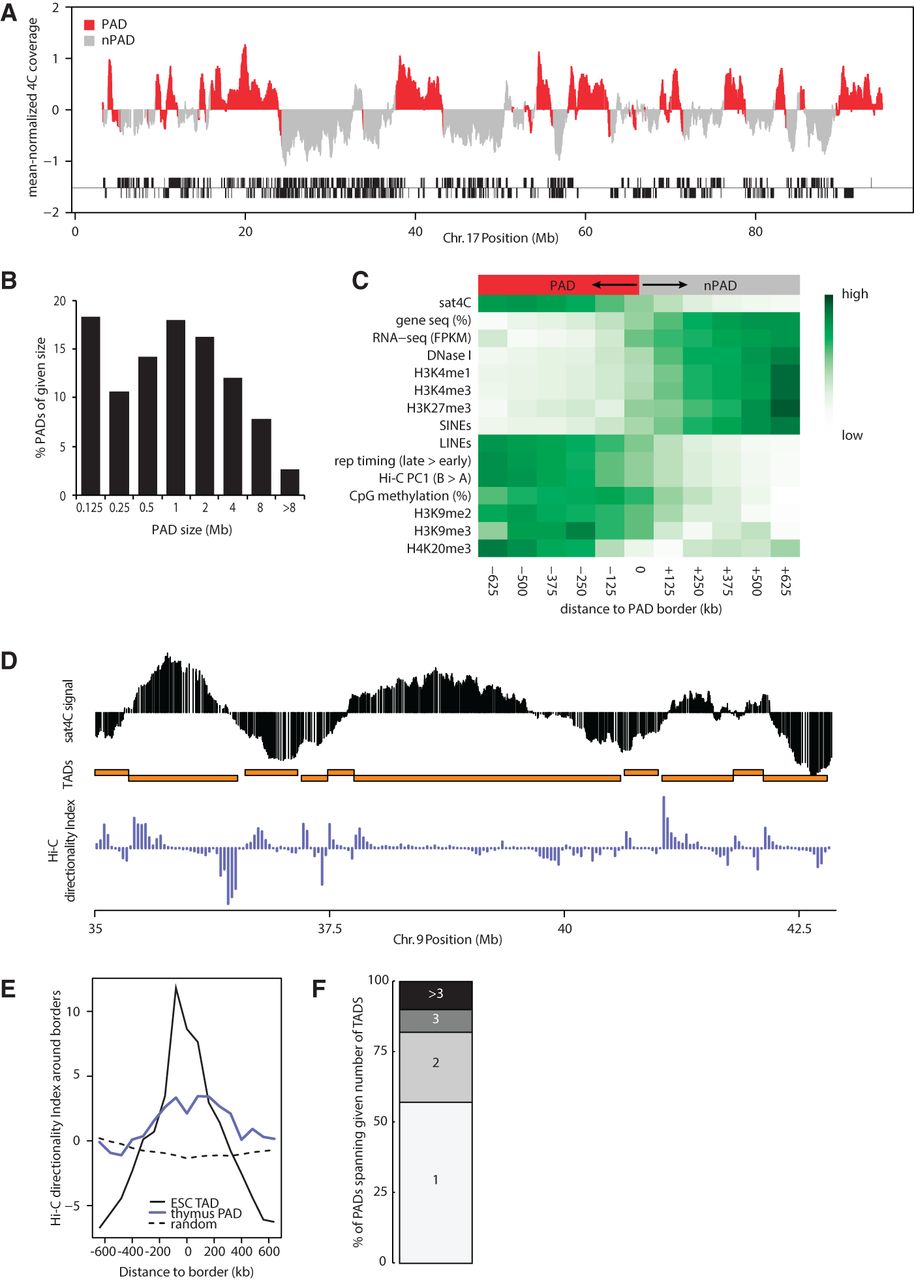
Pericentromeric association segregates repressed chromatin from active chromatin. (A) Sat4C profile of Chromosome 17 with designated PADs (red) and non-PADs (gray) based on a two-state hidden semi-Markov model (HSMM) on three biological replicate thymus samples. Blocks below the sat4C map indicate gene positions on each strand. Note that the HSMM is based on individual reads and may not perfectly align with the running-windowed sat4C signal (see also Fig. 1B). (B) Histogram plot with PAD sizes in thymus (median size 640 kb). (C) Heatmaps showing average enrichment scores for chromatin features in 125-kb windows around PAD borders. Color codes represent normalized values for each feature from minimum to maximum values. (D) Alignment of thymus sat4C profile with ESC Hi-C topological domains (TADs, orange blocks) and the ESC Hi-C directionality index (purple). (E) Enrichment of Hi-C directionality index (averaged over 80-kb windows) around PAD and TAD borders. Note that the absolute value of the index was taken to analyze the amplitude of the directionality bias. (F) Stacked column plot showing the percentage of PADs that span the number of neighboring TADs indicated.


