
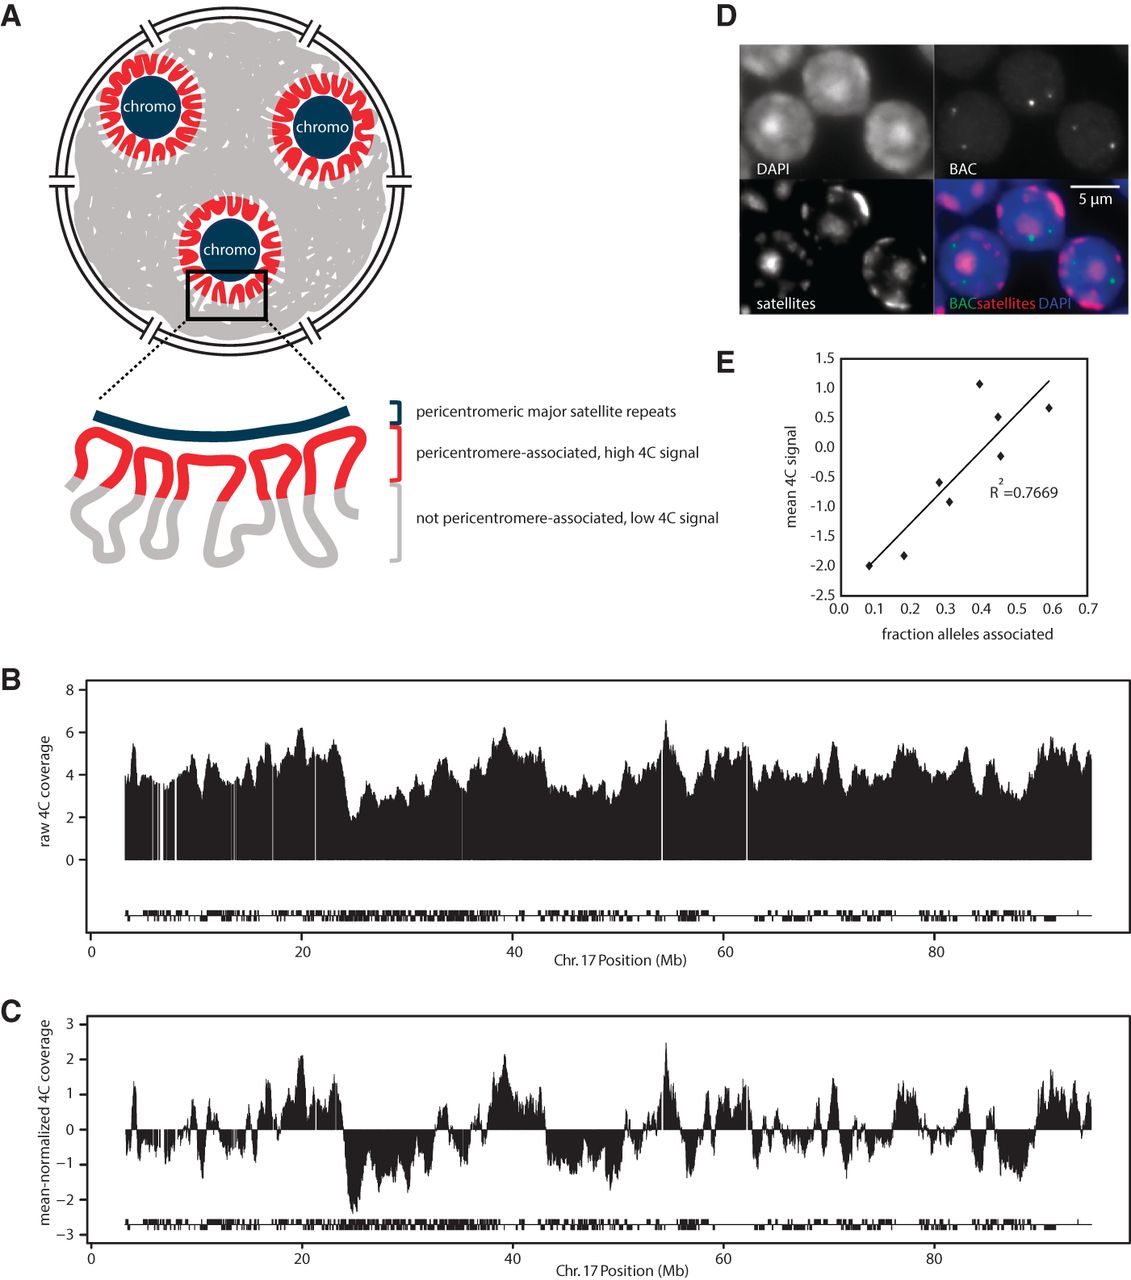
Identification of genomic regions associated with pericentromeric satellite repeats in chromocenters using “sat4C.” (A) Schematic view of pericentromeric satellite repeats in chromocenters (chromo) and their associated genomic regions in the nucleus. (B) Raw 4C coverage plot of sat4C profile of Chromosome 17 from mouse thymus. Blocks below sat4C map indicate gene positions on each strand. (C) Mean-normalized sat4C coverage profile. Same as in B but with the chromosomal mean subtracted to visually highlight regions with relatively high and low sat4C signals (see also Supplemental Fig. S1). Note that this subtraction is a visual aid, and values above or below the 0 line do not necessarily equal associated or nonassociated, respectively. (D) DNA FISH images showing probes used for sat4C validation in E. Scale bar, 5 μm. (E) Correlation between average sat4C signal and the frequency of pericentromeric association in thymus for eight chromosomal regions.


