
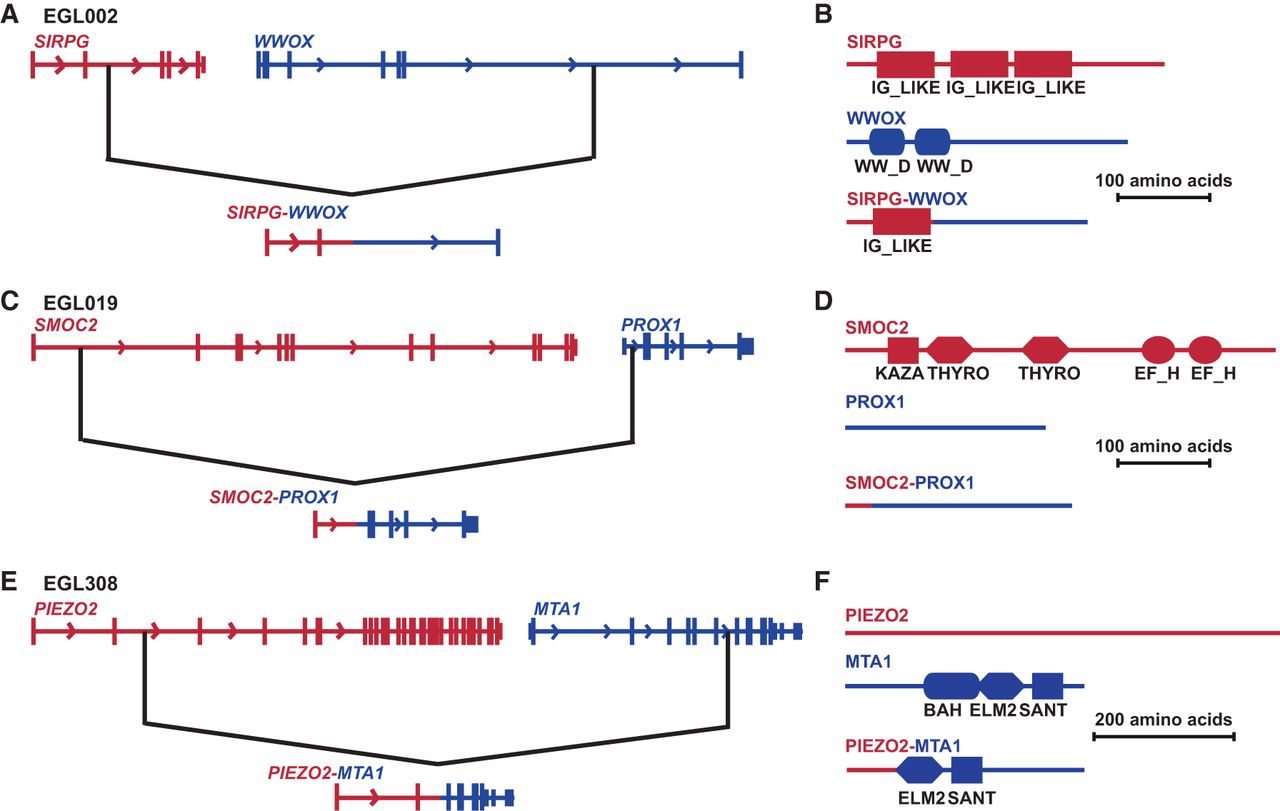
Figure 5.
Predicted in-frame fusion genes at sequenced translocation junctions. Black lines indicate translocation breakpoints in genes (not drawn to scale). (A,B) Fusion of SIRPG and WWOX in EGL002. (C,D) EGL019's SMOC2-PROX1 fusion. (E,F) Fusion of PIEZO2 and MTA1 in EGL308.


