
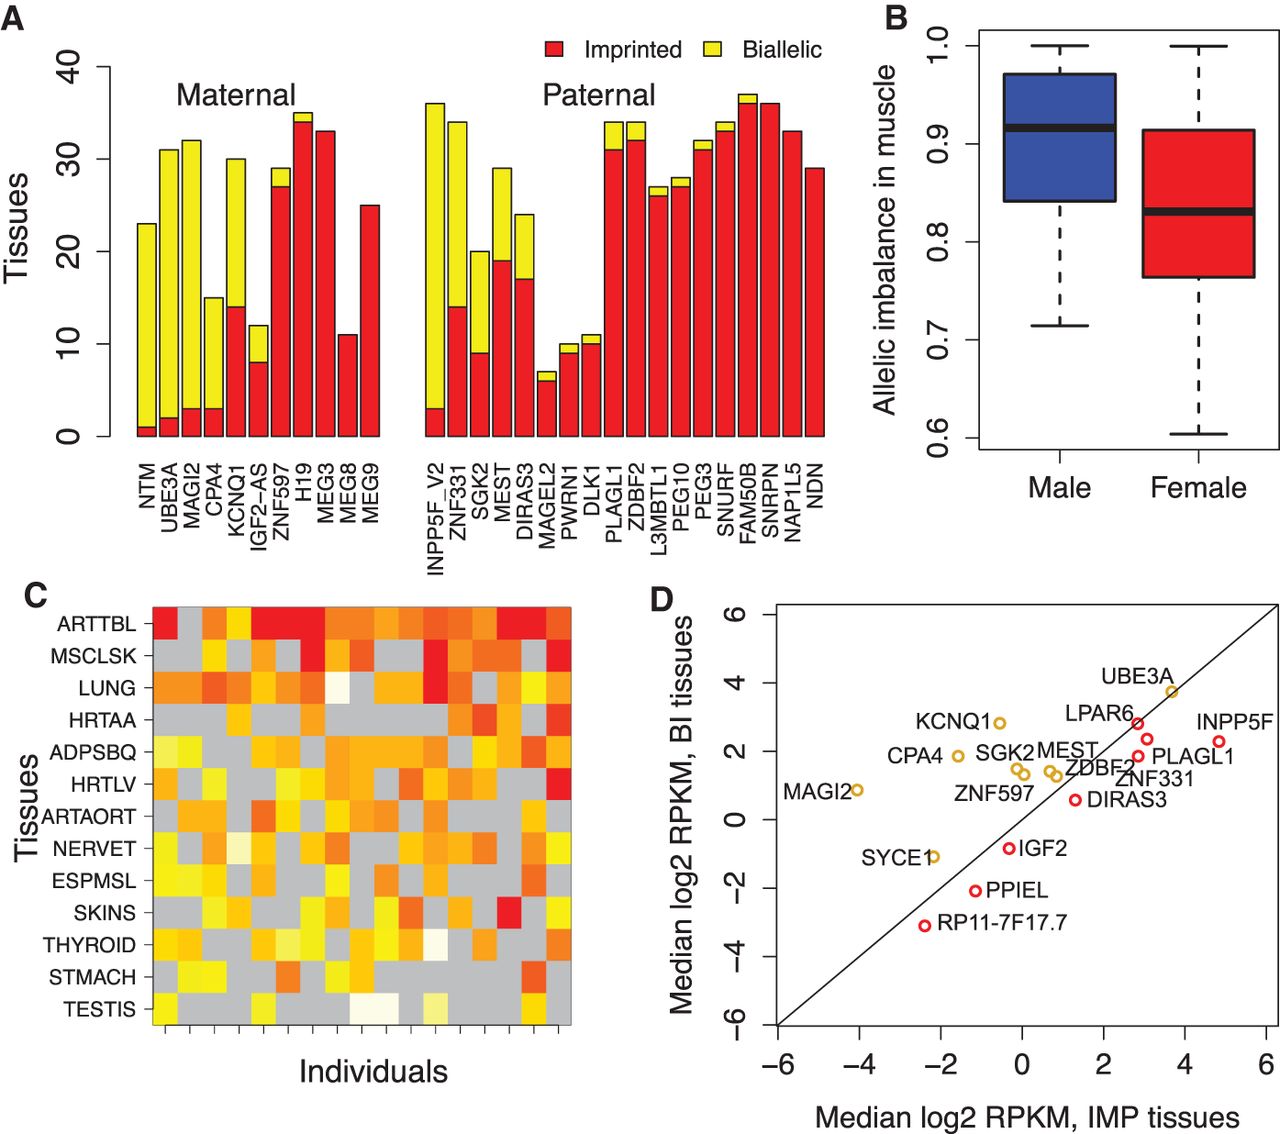
Figure 3.
Variation in imprinting. (A) The number of tissues in which genes are imprinted or biallelic for maternally and paternally expressed genes. (B) Sex-specific imprinting in muscle, where females have lower median τ than males, measured across all genes identified as imprinted in muscle. Each data point corresponds to an individual. (C) An example of variation of imprinting between individuals in ZNF331, with color denoting τ (see Fig. 2). (D) Median expression level of genes in tissues where they are imprinted versus biallelic (see also Supplemental Fig. S20). Only genes with both imprinted and biallelic tissues are shown.


