
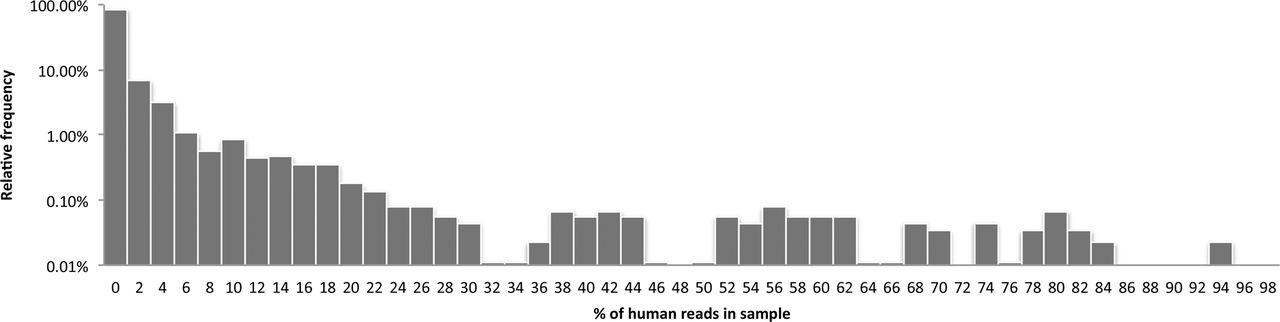
Figure 2.
Histogram showing how often different amounts of human reads are found across the collection of sequencer runs. The x-axis displays human read abundance in sequencer runs in bins of 2%. The y-axis shows the percentage of sequencer runs with the amount of human reads specified on the x-axis using a log scale. The highest fraction of human reads in a sequencer run is 94% and found in one run.


