
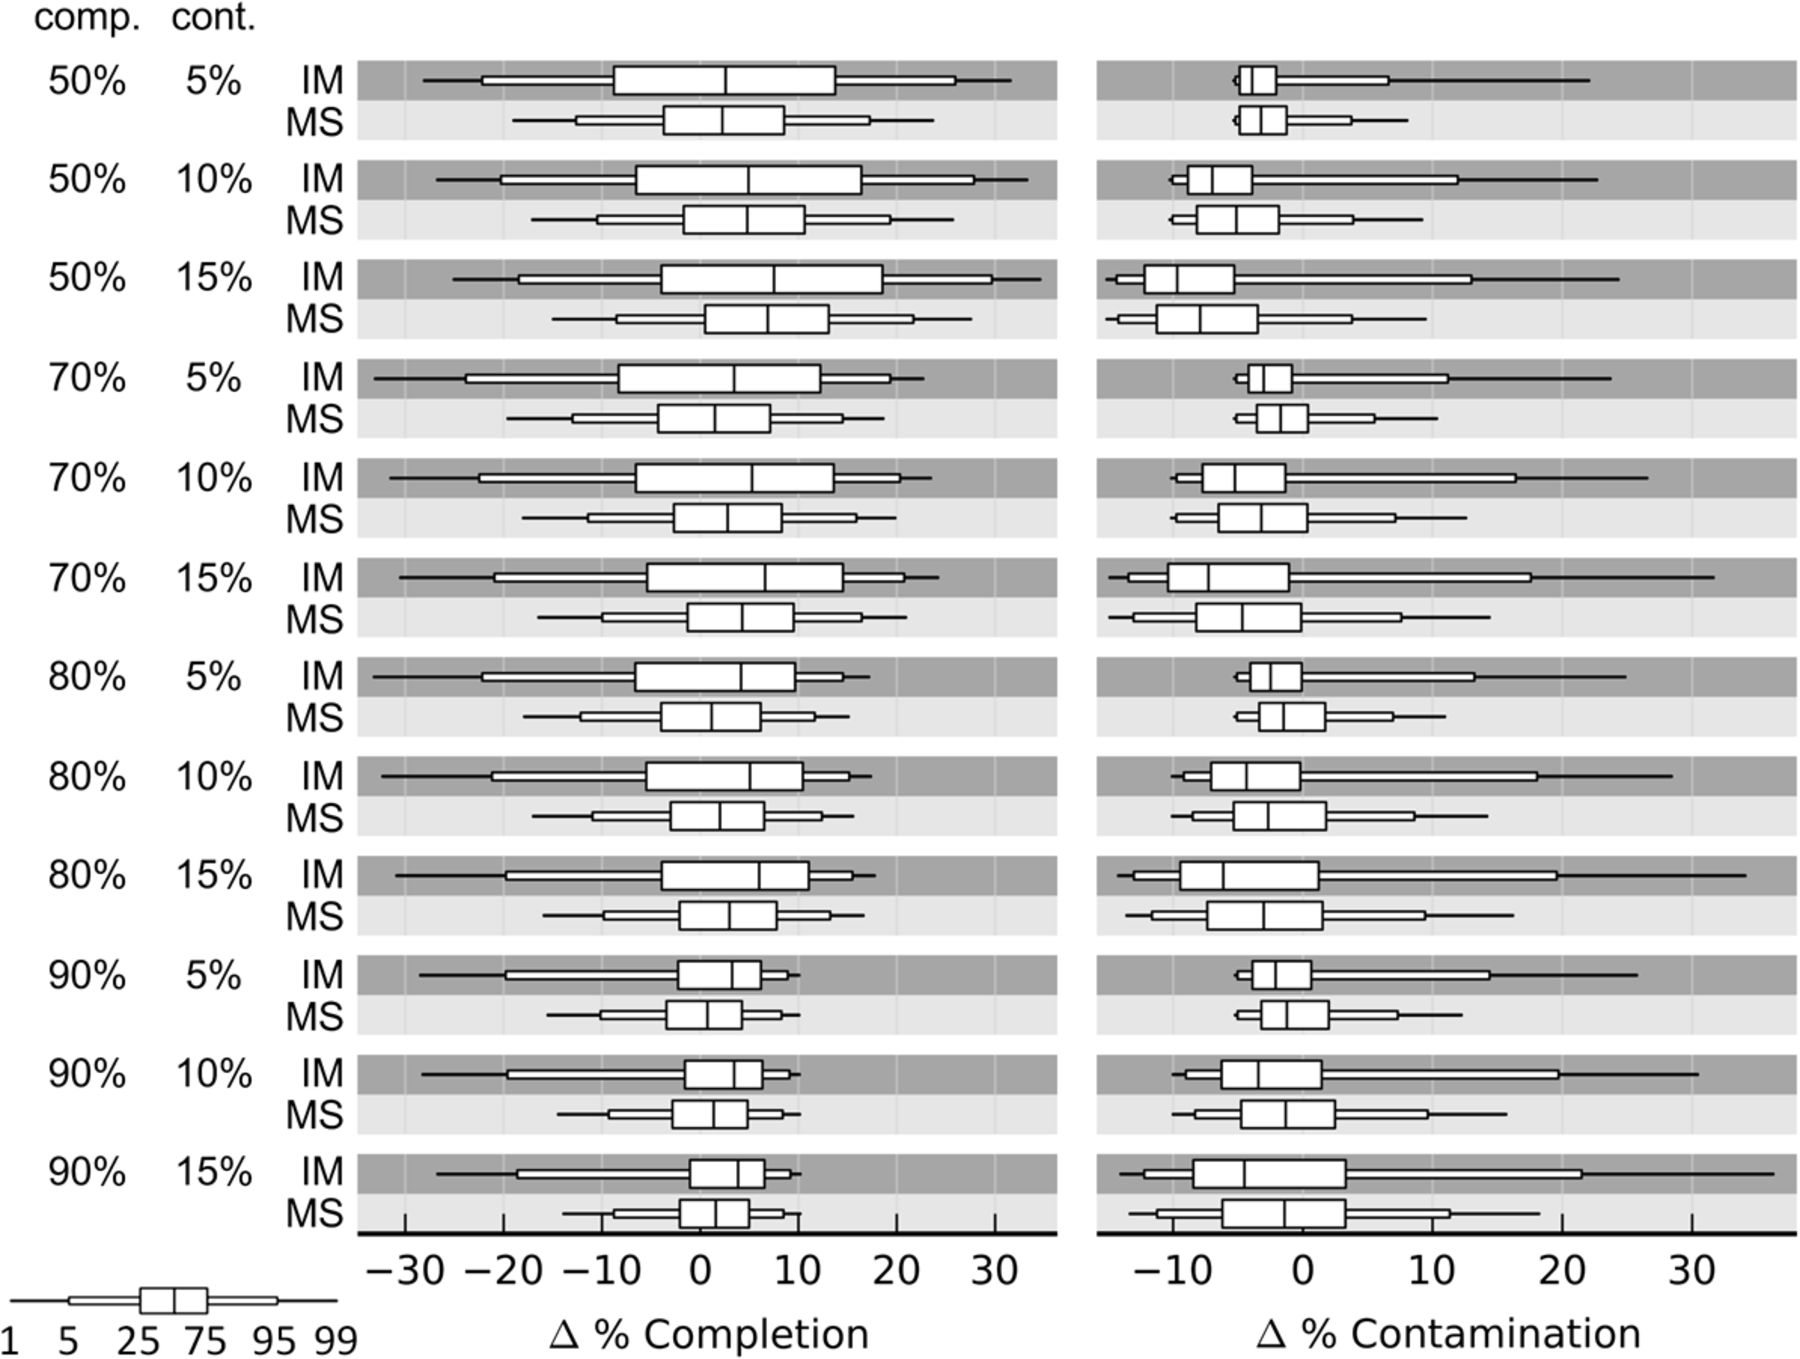
Error in completeness and contamination estimates on simulated genomes with 50%, 70%, 80%, or 90% completeness (comp.) and 5%, 10%, or 15% contamination (cont.). Quality estimates were determined using domain-level marker genes treated as individual markers (IM) or organized into collocated marker sets (MS). Simulated genomes were generated under the random fragment model from 3324 draft genomes spanning 39 classes (20 phyla) with each draft genome being used to generate 20 simulated genomes. A systematic bias in the estimates results in completeness being overestimated on average (median value to the right of zero) and contamination being underestimated on average (median value to the left of zero). Results are summarized using box-and-whisker plots showing the 1st (99th), 5th (95th), 25th (75th), and 50th percentiles.


