
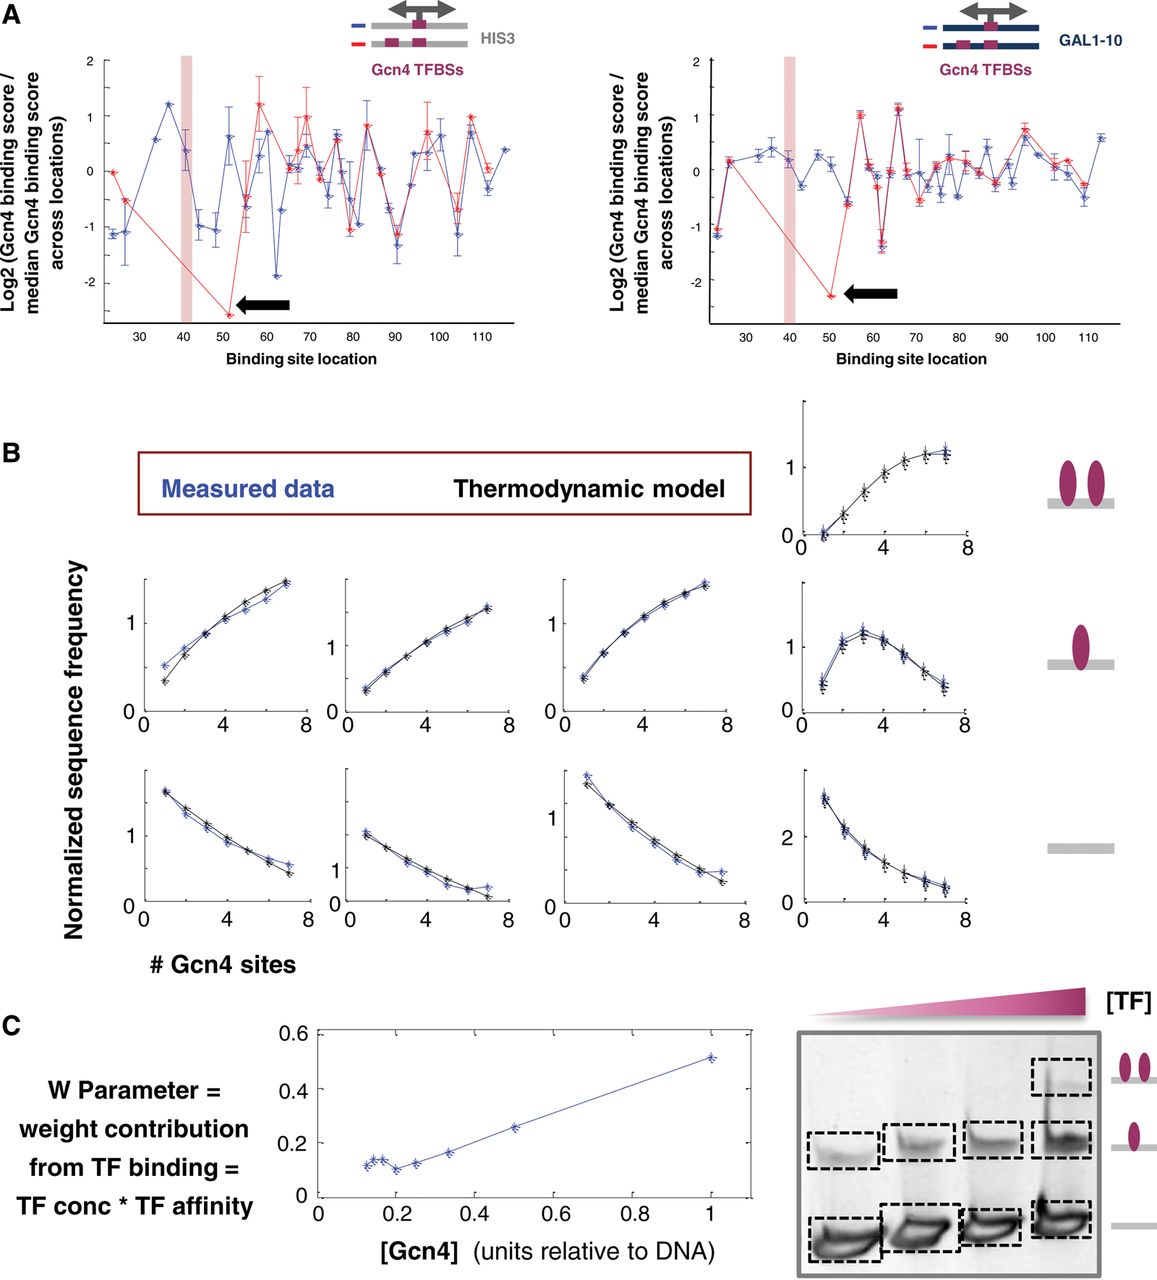
A simple thermodynamic model of TF binding as a function of TF concentration. TFBS multiplicity accounts for the binding measurements. (A) A set of sequences with a strong Gcn4 site placed at different locations along a specific sequence context, either in the presence of an additional strong Gcn4 site located in a fixed location (with the pink rectangle marking the location of the center of this site) (in red) or without this additional site (in blue). Shown is the log2 of the ratio of the binding score attained by each sequence (with the x-coordinate marking the location of the center of the site) divided by the median binding score across all sequences in this set. The binding score for the sequences with a single site is computed based on a band representing a single TF binding (see the band marked by a blue square in Fig. 1), while the binding score for sequences with two sites is computed based on the band representing two TF binding events (see the band marked by a red square in Fig. 1). The black arrow points to a sequence where the 9-bp sites are separated by a single bp. Sequences with Gcn4 TFBSs of 9 bp placed along the HIS3-derived context (left panel) and along the GAL1-10–derived context (right panel). (B) For a set of sequences with all possible combinations of one to seven binding sites for Gcn4 in seven predefined locations, the average frequency of sequences in different bands (“binding states”) is shown as a function of the number of sites within the sequence (in blue). The graphs correspond to the bands displayed in the gel in the right bottom corner. A detailed description of the plotted “normalized sequence frequency” measure can be found in Supplemental Section C. The predictions of these dependencies based on a simple thermodynamic model assuming multiple TF binding events are independent (for detailed description, see Supplemental Section C) and are also plotted (in black). (C) For the single parameter in the thermodynamic model, which represents the weight contribution of a TF binding event and is expected to be proportional to the TF concentration, the value used in the model that best fits the measured data is plotted against a measure of the concentration of Gcn4 that was actually used in the experiments presented here.


