
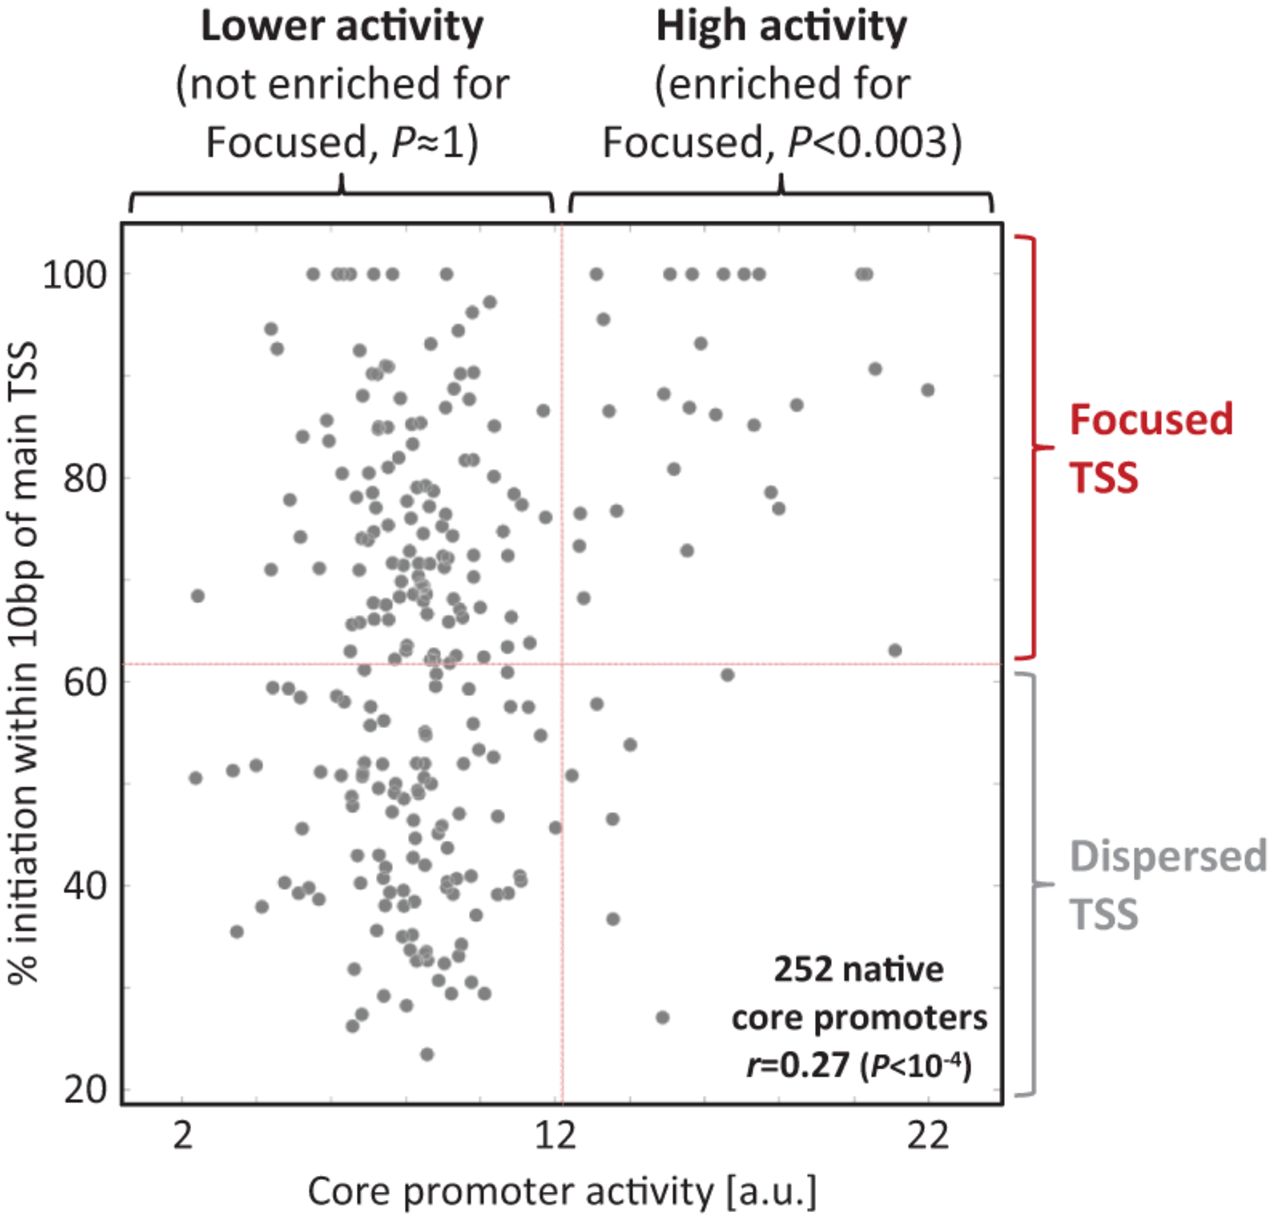
Highly expressed core promoters tend to have focused transcription initiation. A comparison of our core promoter activity measurements (x-axis) to our measure of focused transcription initiation (y-axis) for 252 native core promoters (taken from the union of the two sets in Fig. 2) reveals a significant correlation between the two measures. Based on the center values ([min. + max.]/2) of the two measures, native core promoters were classified as having either high or low activity (x-axis classification) and as having either focused or dispersed transcription initiation (y-axis classification). Core promoters with high activity were found to be enriched for focused transcription initiation.


