
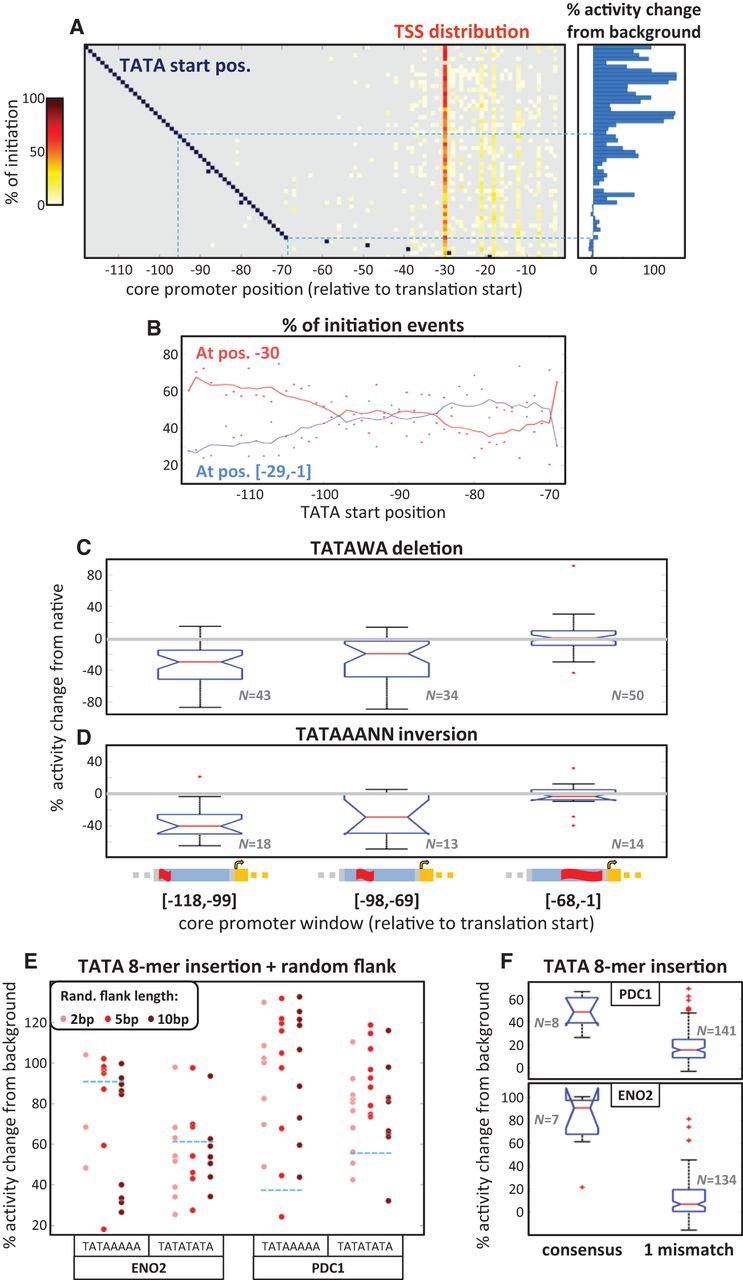
TATA element location, orientation, sequence, and flanking bases affect its functionality. (A) We inserted the TATA consensus 8-mer TATAAAAA into different positions along the PDC1 background sequence (see main text). Each row in the left panel heatmap corresponds to one insertion case, with TATA start position marked in dark blue (in a few cases, the insertion actually resulted in two overlapping TATA 8-mers, and then both start positions are marked), and the measured TSS distribution appearing in red and yellow (see color bar on the left). The effect of every insertion on core promoter activity is shown by the corresponding bar within the right panel. The light blue dashed lines separate the results of three regions: [−118,−96], [−95,−69], and the five insertion positions further downstream. Note that there are a few instances with missing TSS or expression data. (B) For the same data shown in A, an illustration of the percent initiation events (y-axis) at position −30 (red dots) vs. positions [−29,−1] (blue dots), as a function of the TATAAAAA 8-mer insertion start position (x-axis). The trend lines of corresponding colors show the moving average using a sliding window of length 10. (C) Box plots of the percent changes to core promoter activity caused by knockout mutations of native TATA elements having the consensus 6-mer TATAWA (W = A/T), in three core promoter windows: [−118,−99], [−98,−69], and [−68,−1]. Assignment to windows was based on the TATAWA start position. (D) Same as in C for inversions of native TATAAANN (N = A/C/G/T) 8-mers. (E) For insertions of the TATAAAAA and TATATATA consensus TATA 8-mers into position −98 of the ENO2 and PDC1 backgrounds, we also generated instances in which we additionally randomized their flanking sequences of lengths 2, 5, or 10 bp. For each such instance, we plotted the percent change to core promoter activity (y-axis). Pink, red, and dark red dots mark cases with random flanks of 2 bp, 5 bp, and 10 bp, respectively. Dashed light blue lines mark the value measured for insertions without flanking sequence randomization. (F) Box plots of the percent changes to core promoter-induced expression caused by insertion (into position −98) of either consensus TATAWAWR (W = A/T, R = A/G) 8-mers or TATA 8-mers that are one mismatch away from a consensus 8-mer. (Top) Insertions into the PDC1 background; (bottom) insertions into the ENO2 background.


