
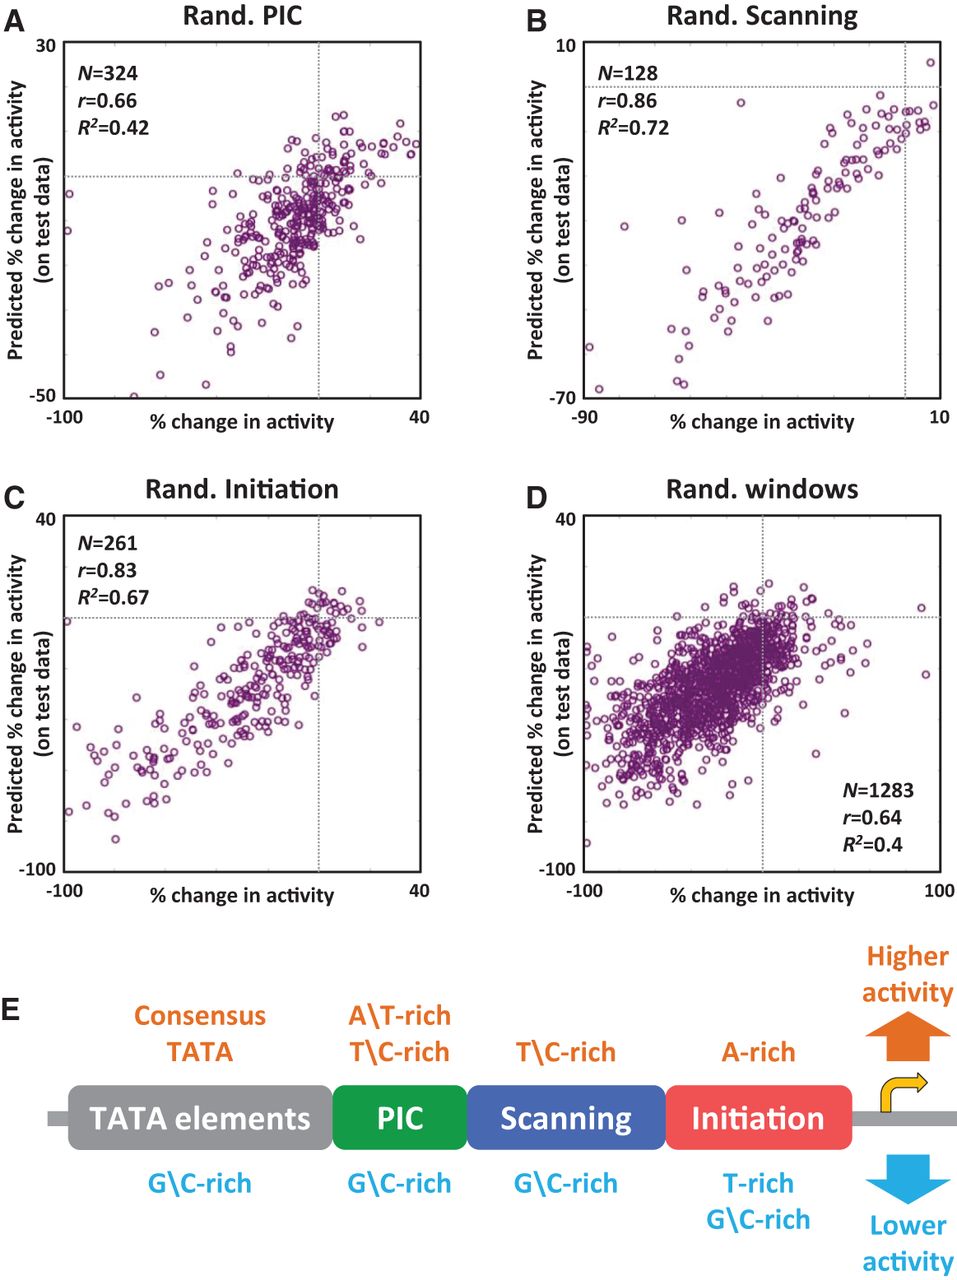
Sequence variation in different core promoter regions substantially affects activity. Results of learning linear models that predict the effects of mutating various native core promoter regions (see main text) on core promoter activity, based on sequence features that measure differences between mutant and native core promoters. We used a K-fold cross-validation scheme, such that each mutant appeared once in a held-out test set, and K − 1 times in a training set. (A) Results for PIC region mutations. For each mutated core promoter, we plotted its measured percent change (compared to the native core promoter) in core promoter activity (x-axis) against its predicted one (y-axis, predicted by the linear model learned when that mutant was part of the held-out test set). Gray lines mark the axes’ zero values. We also report mean performance measures (r and R2 statistics) of the models over the test sets. (B) Same as A for scanning region mutations. (C) Same as A for initiation region mutations. (D) Same as A for sliding window mutations. (E) An illustration summarizing classes of sequence features included in our linear models and their predicted effect on core promoter activity. All learned features are specified in Supplemental Figures 1–4. The golden right arrow marks the translation start site.


