
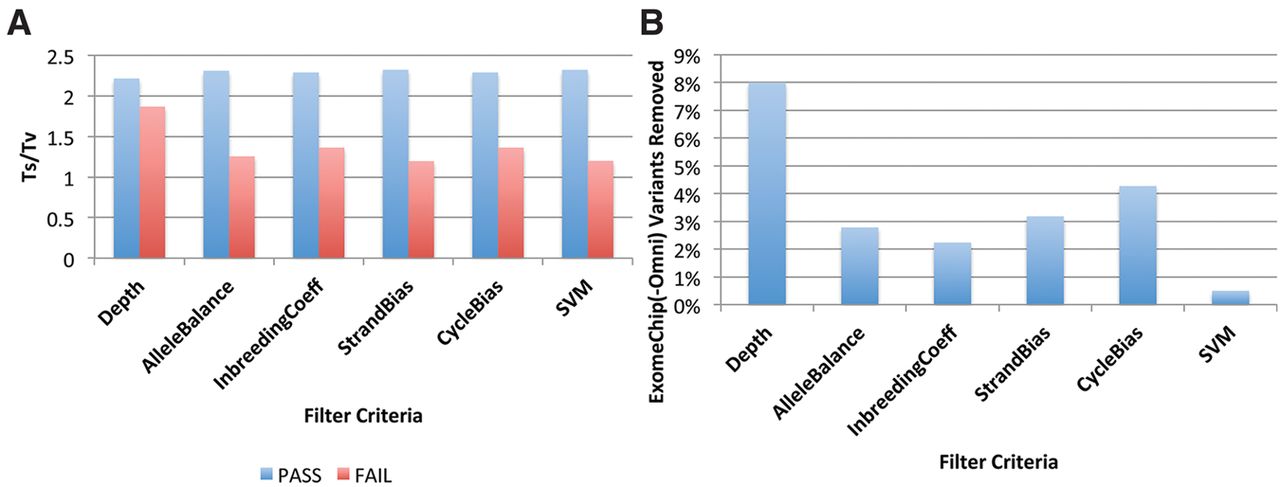
Figure 4.
Comparison of SVM filtering with hard filtering based on a single feature. (A) Ts/Tv of filtered-in (PASS) and filtered-out (FAIL) variants using different filters. Variants are ordered by a single variant feature and a fixed fraction of variants (8%) are filtered out to match the variant counts with the default SVM filter. Absolute values are used for StrandBias correlation and CycleBias correlation. (B) Percentage of filtered-out HumanExome BeadChip (Omni2.5) variants among those that are polymorphic in the array genotypes.


