
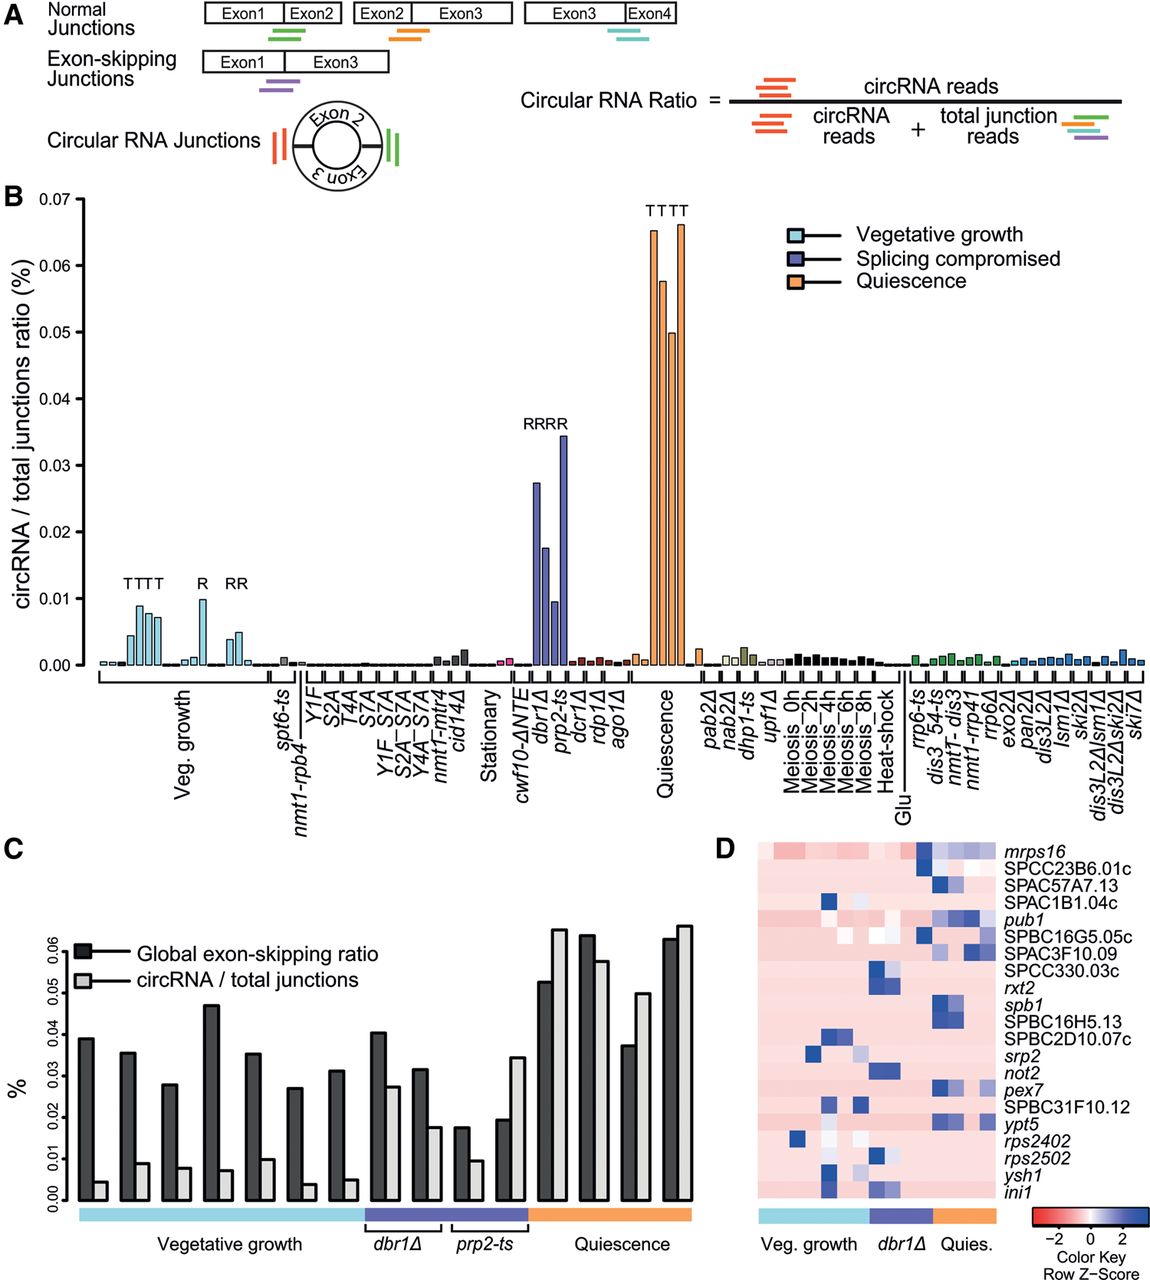
Analysis of circular exonic RNAs. (A) Scheme showing normal, exon-skipping, and circRNA transcripts. The colored lines below the junctions represent diagnostic reads for normal splice junctions (green, orange, cyan), exon-skipping junctions (purple), and circular junctions (red). These diagnostic reads were used to calculate global circular to total junction ratios and local circular to normal junction ratios used in B–D. (B) Global circular to total junction ratios across samples, reflecting the proportion of circRNA reads among total (normal and exon-skipping) junction reads. Physiological conditions or mutants as indicated below were grouped and color coded according to cellular function or condition tested (Supplemental Table S1). Samples were poly(A)-enriched, apart from those marked “T” (total RNA) or “R” (ribosomal depleted). (C) Global exon-skipping ratio compared to circular to total splice junction ratios in all non-poly(A)-enriched samples as indicated. (D) Heatmap for the 21 circRNAs most reproducible in total RNA and ribosomal-depleted samples, with corresponding genes indicated. The global circular to total junction ratio includes exon-skipping reads, whereas the local circular to normal junction ratio excludes exon-skipping reads in any given locus (Supplemental Table S11). Maximum distance between rows (circRNAs) was determined as indicated in Figure 3A.


