
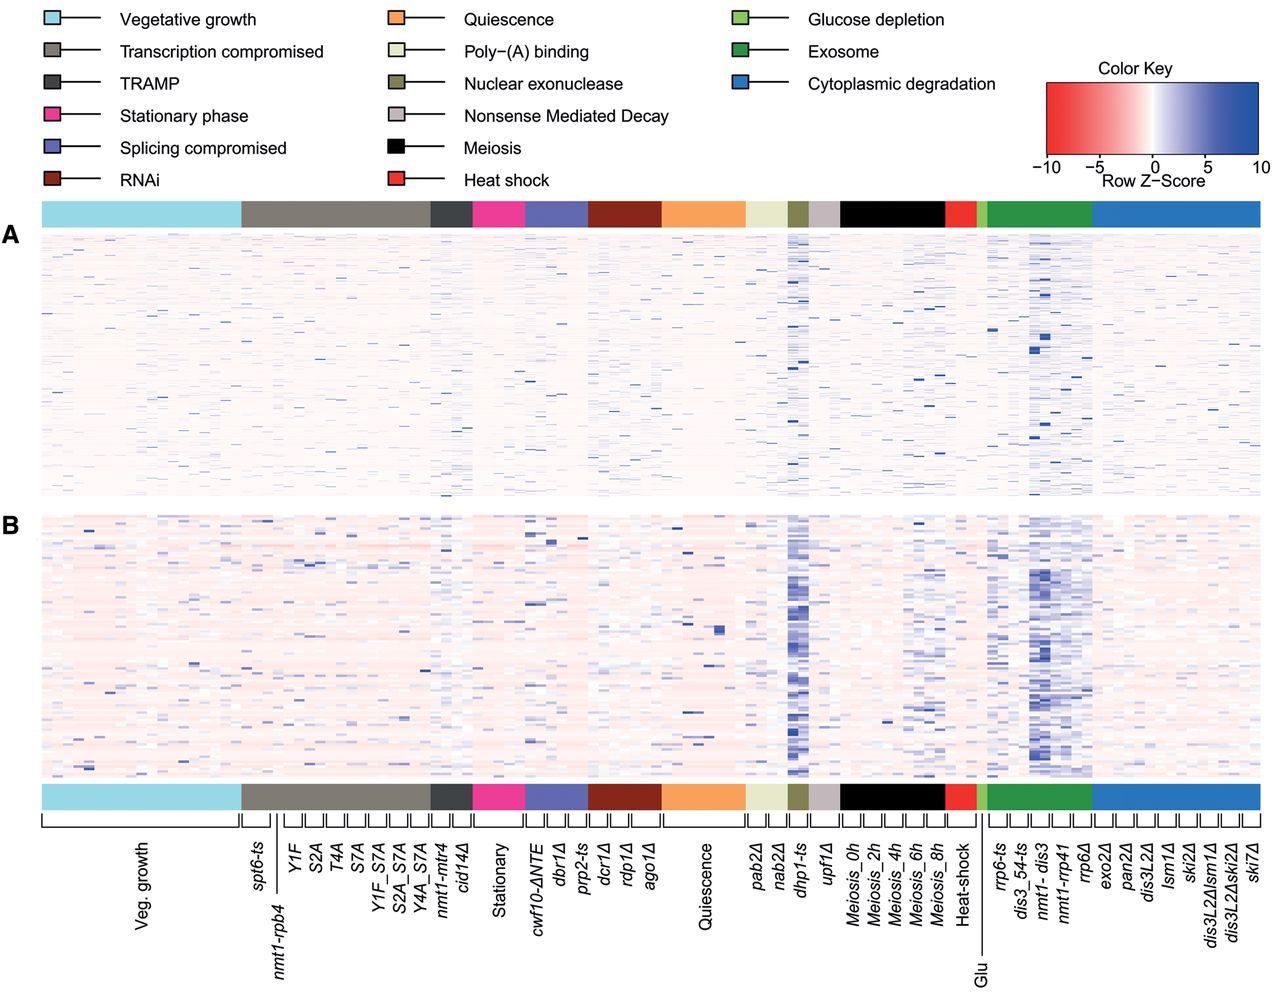
Splice variant-specific, local exon-skipping ratios (ESR) highlighting the stochastic nature of exon skipping. (A) Heatmap representing 2504 exon-skipping events for which both normal splicing and exon-skipping reads were identified in one or more samples (ratios provided in Supplemental Table S4). Physiological conditions or mutants as indicated below were grouped and color coded according to cellular function or condition tested. Maximum distance between rows (exon-skipping events) was determined using the “dist” function in R (method “maximum”), followed by hierarchical clustering using the “hclust” function. Row Z-score: Ratios in each row were scaled by subtracting the mean of the row from each value, followed by division of resultant values by the SD of the row, i.e., (local ESR value − row mean)/row SD. (B) As in A but showing local ESR for the high confidence set (111 exon-skipping events supported by nine or more exon-skipping reads in one or more samples). Only 107 exon-skipping events for which both normal and exon-skipping reads were identified in one or more samples are shown (Supplemental Table S5).


