
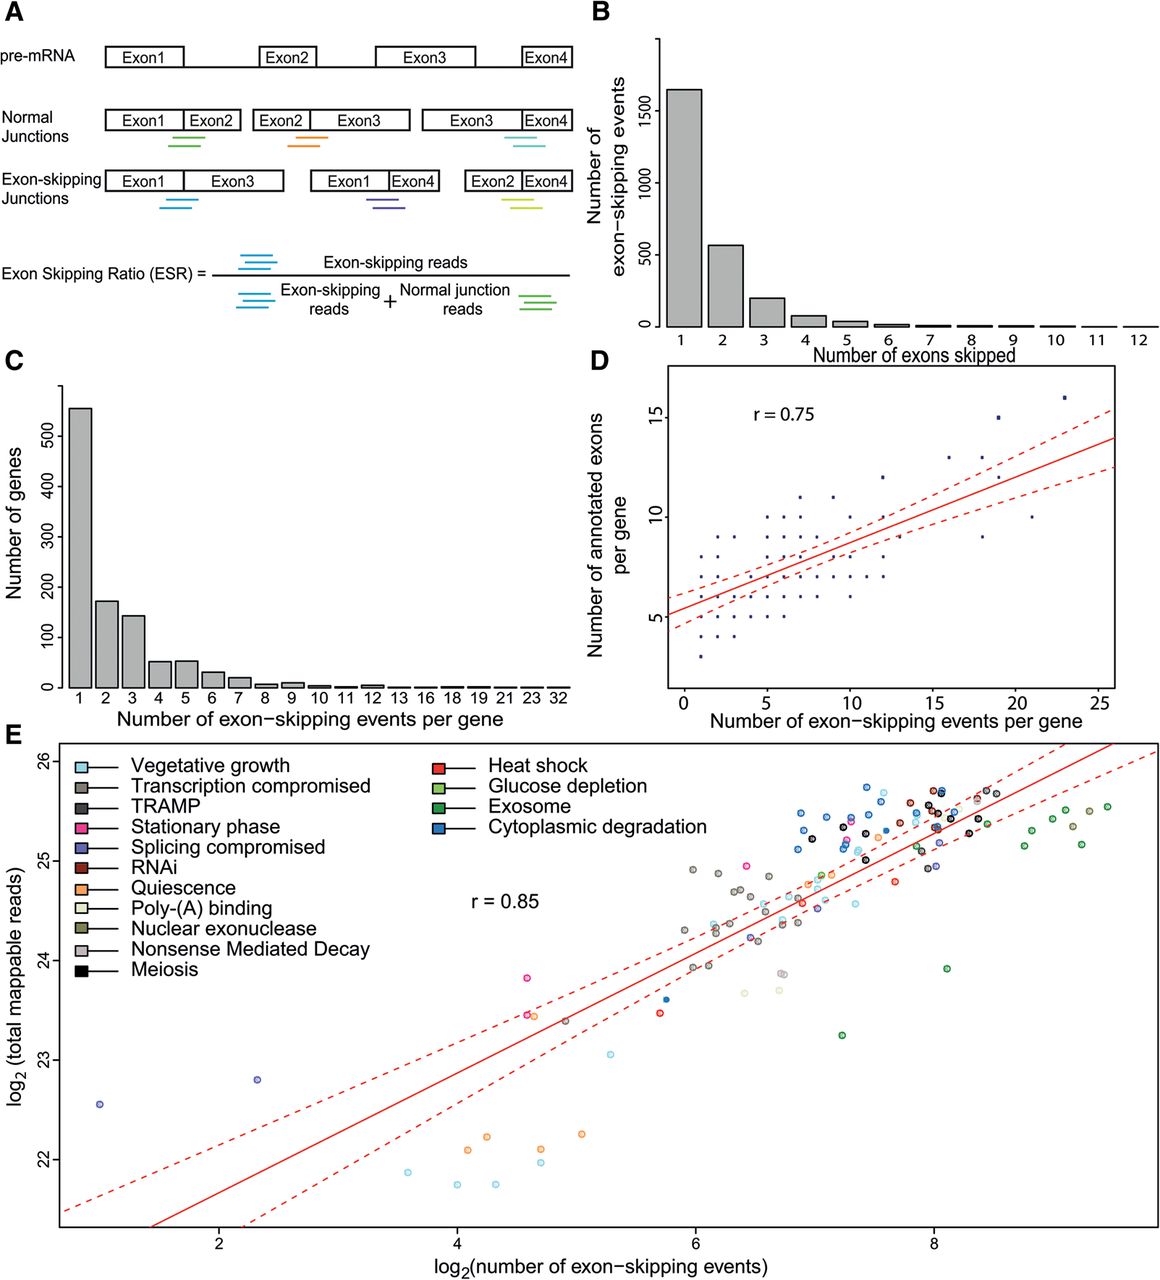
Identification and characterization of exon-skipping events using RNA-seq. (A) Scheme showing pre-mRNA (top) along with all possible normally spliced mRNAs and exon-skipping isoforms. The colored lines below the junctions represent diagnostic reads for normal exon–exon junctions (5′-3′; green, orange, cyan), and for exon-skipping junctions (5′-3′; blue, purple, light green). These diagnostic reads were used to calculate the exon-skipping ratio (ESR) and to identify splice isoforms. (B) Total number of exon-skipping events (y-axis) as a function of number of exons being skipped (x-axis; ranging from one to 12 skipped exons during a single event); 2574 skipping events are shown. (C) Maximum number of exon-skipping events recorded per gene (x-axis) as a function of gene number (y-axis). (D) Correlation between numbers of exon-skipping events per gene and numbers of annotated exons in the same gene. In total, 1063 genes were binned based on number of detected exon-skipping events and number of their annotated exons. The size of data points was scaled according to number of genes in each bin, i.e., normalized by number of genes in the genome containing a corresponding number of exons; (r) Pearson's correlation coefficient; (red line) fitted regression; (dotted red lines) 0.95 confidence levels. (E) Correlation between sequencing depth and number of exon-skipping events. Strains were grouped and color coded according to cellular function or condition tested (Supplemental Table S1); (r) Pearson's correlation coefficient; (red line) fitted regression; (dotted red lines) 0.95 confidence levels.


