
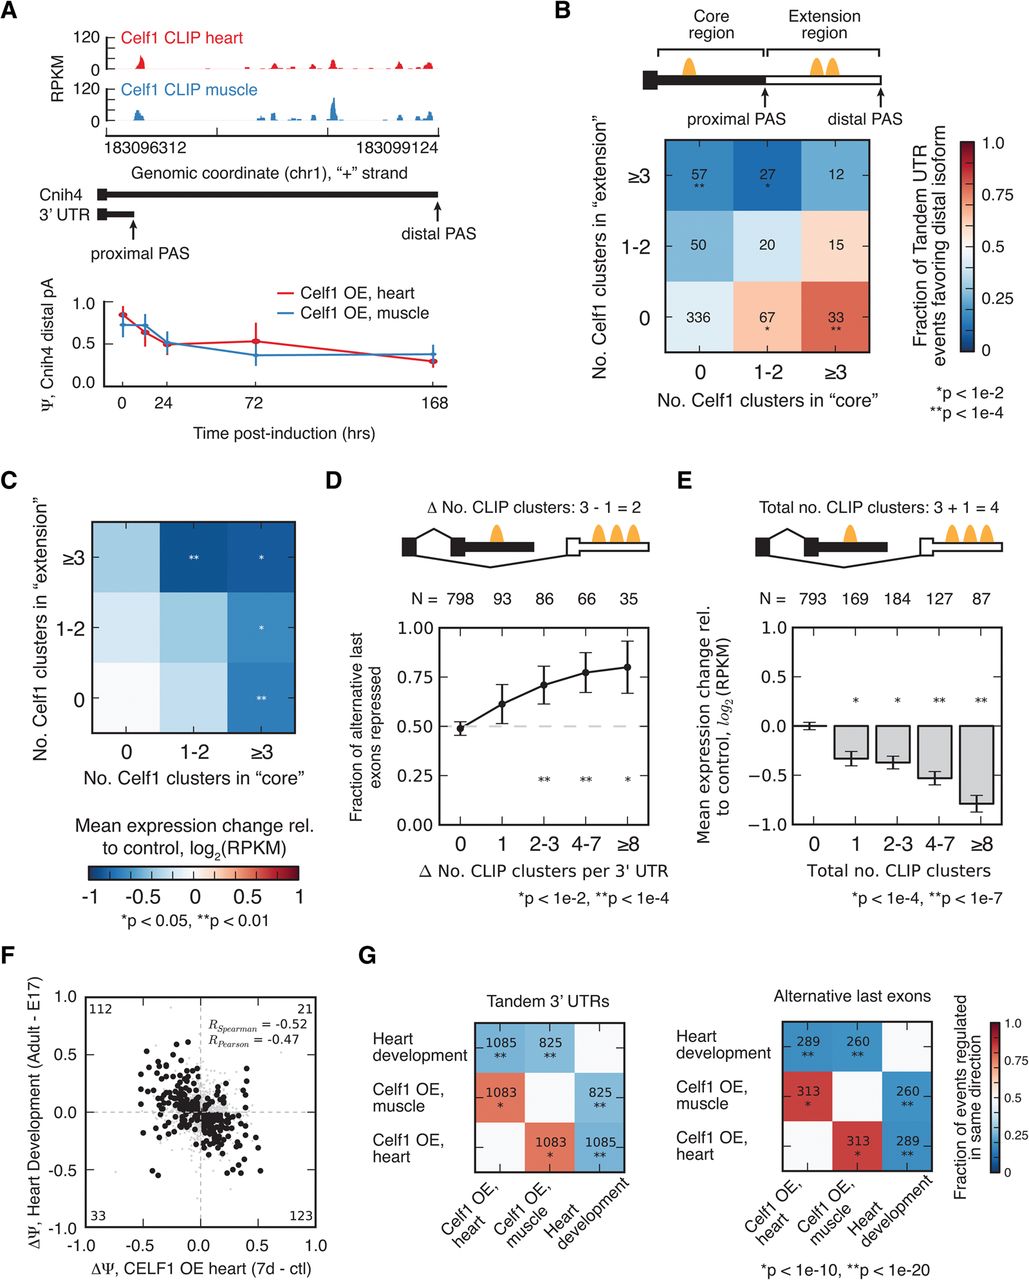
CELF1 regulates abundance of bound alternative 3′ UTRs, reversing developmental changes. (A) CELF1 CLIP-seq density in 3′ UTR of the Cnih4 gene, which has two alternative PASs whose relative abundance changes following CELF1 overexpression and during heart development. (B) CELF1 regulates tandem 3′ UTR events in a manner that is dependent on the number of binding sites in the core and/or extension region of the 3′ UTR. The heatmap shows the fraction of tandem UTR events biased toward usage of the proximal PAS following CELF1 overexpression in muscle for events grouped by the number of CLIP clusters in the proximal or distal region of the 3′ UTR (MZ > 1.6). Significance was assessed by binomial test, assuming equal likelihood for usage of long or short isoforms. (C) Messages with regulated tandem 3′ UTR events tend to be down-regulated following CELF1 induction. The heatmap shows the mean expression change following CELF1 induction in muscle for genes harboring events grouped by the number of CLIP clusters in the proximal or distal region of the 3′ UTR. Significance was assessed by rank-sum test, where each bin was compared to the bin with zero CLIP clusters. (D) CELF1 regulates ALE expression in a manner that is dependent on the number of binding sites in the competing 3′ UTRs. The fraction of ALEs that is significantly repressed following CELF1 overexpression in muscle, grouped by density in repressed 3′ UTR minus density in enhanced 3′ UTR (MZ > 1.5). Significance was assessed by binomial test, assuming equal likelihood for usage of each ALE isoform. (E) Messages with CELF1 binding within ALEs tend to be down-regulated following CELF1 induction. (Bar plot) Mean expression change following CELF1 induction in muscle for genes with varying numbers of CLIP clusters within ALEs. Significance was assessed by rank-sum test relative to genes with no CLIP clusters. (F) Changes in ALE usage during heart development inversely correlate with those that occur in response to CELF1 overexpression in heart. Correlation coefficients shown for events meeting a minimum Z-score threshold (heart development, 1.4; CELF1 OE, 1.8), as in Figure 1B. (G) Spearman correlation coefficients and significance of correlation are displayed in heatmap format for change in ALE usage (right) or change in tandem 3′ UTR usage (left) for pairwise comparisons of isoform changes during heart development, CELF1 overexpression in heart, and CELF1 overexpression in muscle. See also Supplemental Figure S6.


