
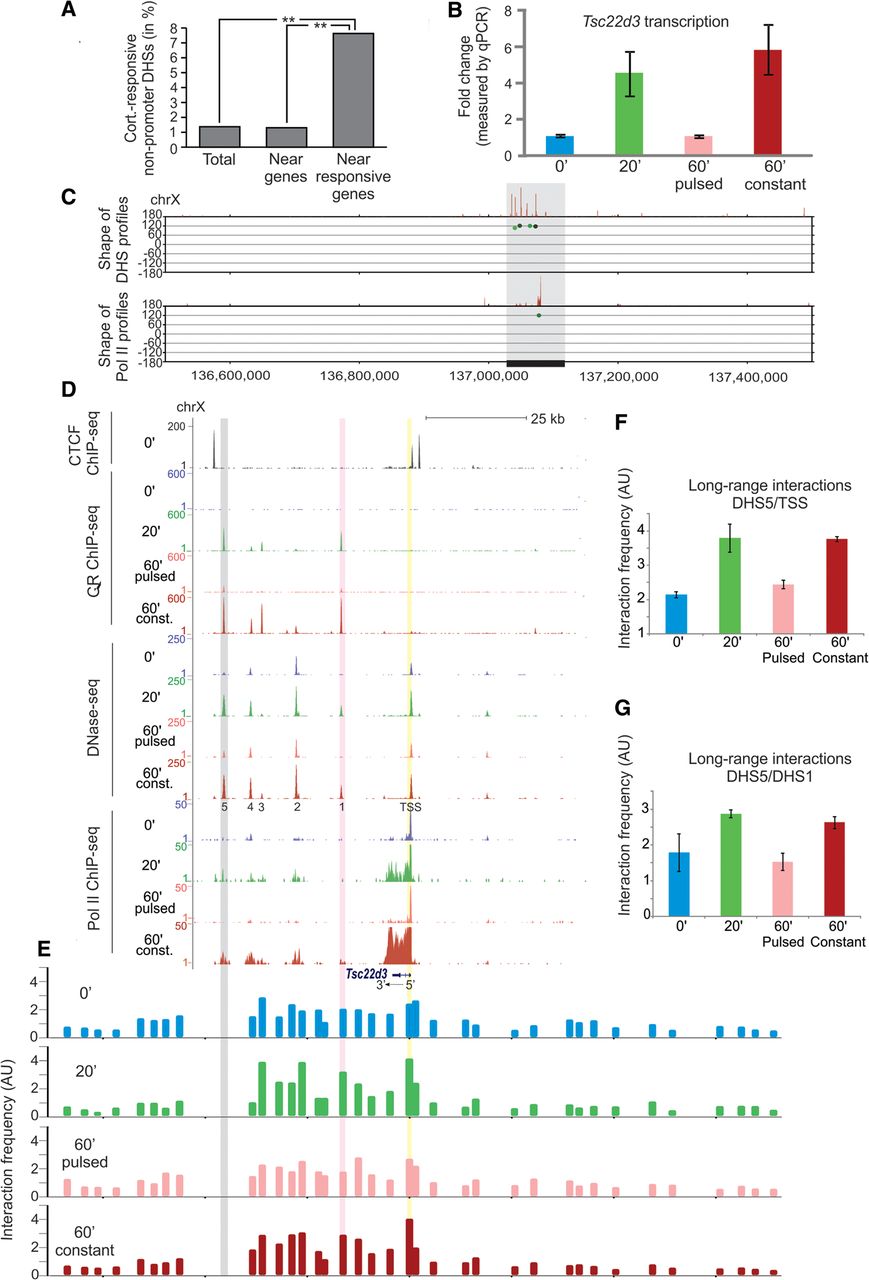
Spatiotemporal correlations between lifetimes of the DNase I hypersensitivity sites and transcriptional activity. (A) Dynamic DHSs are enriched within ±50 kb of the TSS of hormone-responsive genes, suggesting a possible role for these hypersensitive sites in gene regulation (promoter DHSs, i.e., TSS ± 2.5 kb was excluded). (B) Real-time qPCR experiments, using primers recognizing the nascent RNA, demonstrate that transcription of the Tsc22d3 gene is regulated in a hormone-dependent manner (see also Pol II ChIP-seq panel in D). Error bars represent the mean ± SEM, n = 4. (C) Pol II-S5 occupancy over the Tsc22d3 gene (lower panel) and the nearby DHSs (upper panel) all have a transient behavior in response to pulsed hormone stimulation (∼120° hue, vertical axis) and are the main hormone responsive elements in this genomic locus. (D) ChIP-seq and DNase-seq tracks displayed for the gray region in C reveal that the Tsc22d3 gene and the DHS cluster are enclosed by CTCF sites. In addition, although all distal DHSs are bound by GR, the promoter of this gene is largely lacking GR, suggesting that its transcriptional response to hormone stimulation depends on the long-range interactions with distal regulatory elements. (E) A modified chromosome conformation capture approach using the most distal DHS (DHS5) as a bait (gray shading) demonstrates a hormone-dependent increase in the interaction frequency of this DHS with the TSS region of the gene (yellow shading) as well as with another GR-bound DHS (purple shading). (F) Interaction frequency of DHS5 with a region close to the TSS (yellow shading) doubles in response to the hormone stimulation and reverts to its original level upon hormone withdrawal. Error bars represent the mean ± SEM, n = 4. (G) A similar trend was observed for the interaction of the DHS5 with the promoter proximal DHS1 (pink shading). Error bars represent the mean ± SEM, n = 4.


