
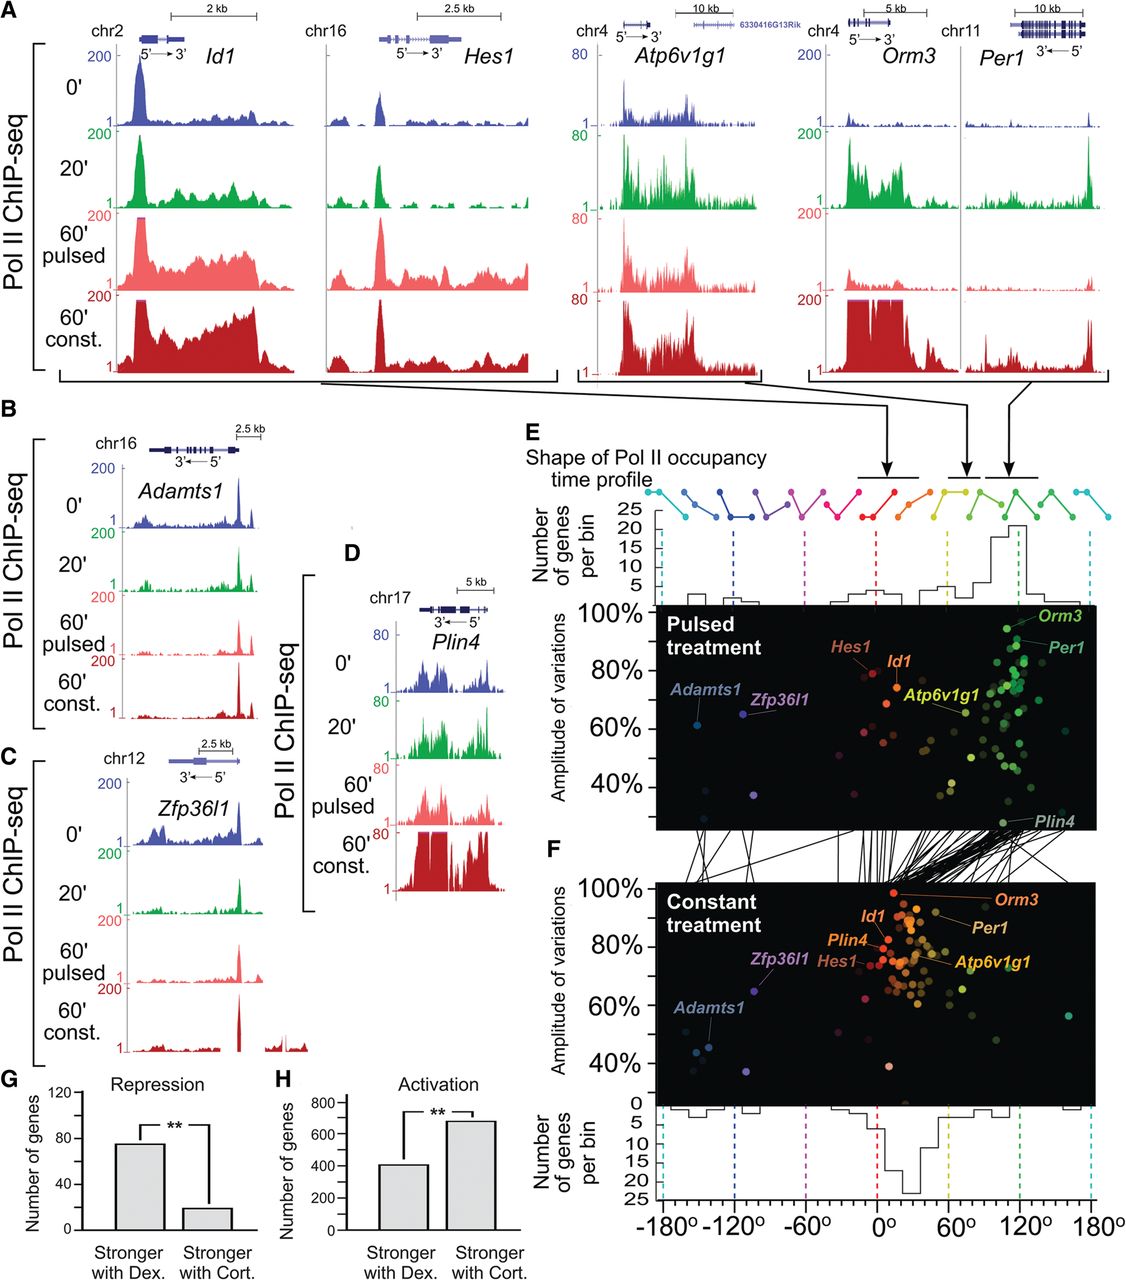
Diverse Pol II occupancy time profiles over gene bodies. (A–D) Examples of Pol II-S5 ChIP-seq signal over gene bodies in response to pulsed and continuous hormone stimulations. (E,F) HSV scatter plots are used to visualize the variety of time profiles of Pol II-S5 occupancy over the gene body of hormone-responsive genes (see Methods) in the case of both pulsed (E) and constant (F) hormone stimulations (see Supplemental Movie S3). Upper and lower panels in E and F, respectively, represent the distributions of time profiles (hue) in both conditions. The black lines between E and F connect the respective Pol II-S5 time profiles for each individual gene under pulsed and constant treatments, highlighting, in particular, that genes responding to a pulsed treatment with a transient activation (∼90° to 130° hue) display a steadily increasing response in the case of a constant treatment (∼10° to 50° hue) and merge with the broad category of genes showing an activation in both treatments. (G,H) Comparison of the effects of natural and synthetic hormones (corticosterone and dexamethasone, respectively) on GR-mediated transcriptional responses revealed striking ligand-specific effects (see also Supplemental Fig. S8I). (G) Dexamethasone revealed much stronger inhibitory properties than corticosterone (P-value <5 × 10⁻⁹, binomial test), whereas the latter (H) was a more potent transcriptional activator (P-value <2 × 10⁻¹⁶, binomial test).


