
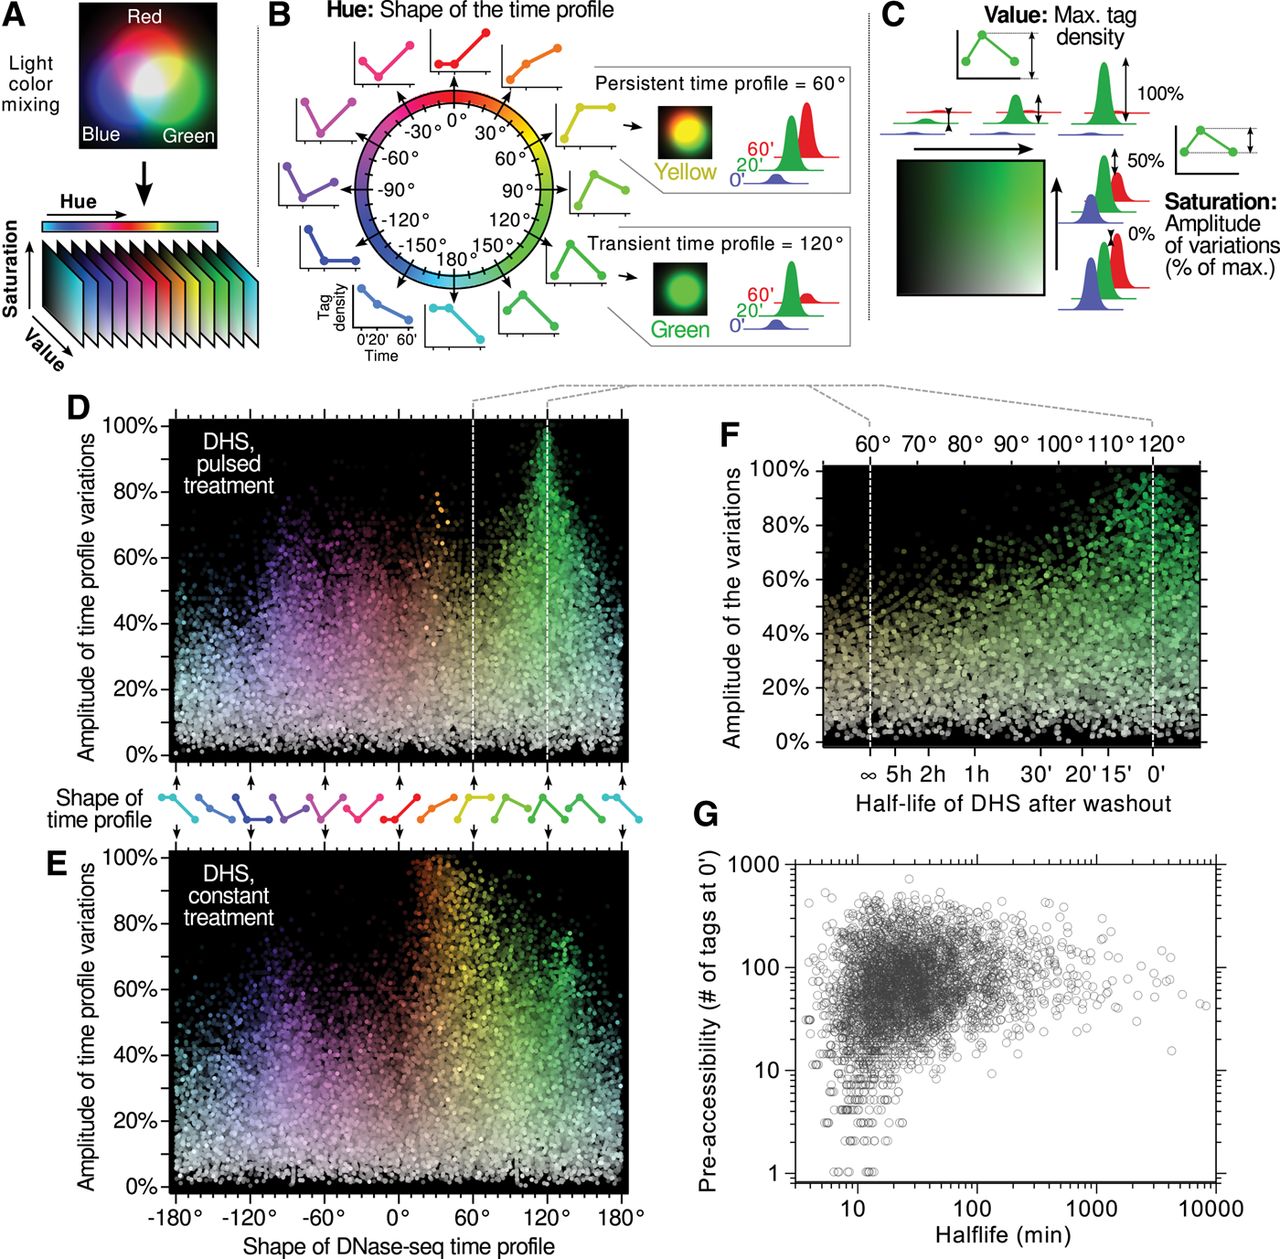
Hue-saturation-value (HSV) color-space interpretation of DHS time profiles. (A) The method presented here for analyzing time profiles is inspired from a color representation used in computer graphics that mimics our natural perception. Any color, i.e., any relative proportion of the three primary light colors (blue, green, and red) can be represented in this so-called HSV color space, yielding three parameters: hue, saturation, and value. This transformation is used here to interpret triplets of experimental data points (e.g., tag density at a DHS site at 0, 20, and 60 min over the course of an experiment) as if each of them were describing the intensity of a primary color. The resulting three parameters have the following interpretation: (B) “Hue” is a circular measure (i.e., an angle) that naturally sorts out as a single continuous variable all the possible shapes of the time profile, regardless of its minimal and maximal values. (C) “Saturation” and “Value” parameters describe the range over which the data points are spanning, independently of the shape of the profile. The “Value” is the maximum of all three time points, and the “Saturation” represents the amplitude of the variations as a fraction of the maximum (0% meaning no variations and 100% meaning the smallest time point is null). Using this representation, strong and highly responsive sites are bright and colorful, whereas dimmer colors mean fewer variations, and grayer colors mean weaker sites. (D,E) DHS time profiles are represented using the HSV method. (F,G) The partial recovery in the 60°–120° range can be mapped directly to a half-life of DHS, which can be further compared with preaccessibility levels (shown in G are only sites having at least a 25 tags increase between 0 and 20 min).


