
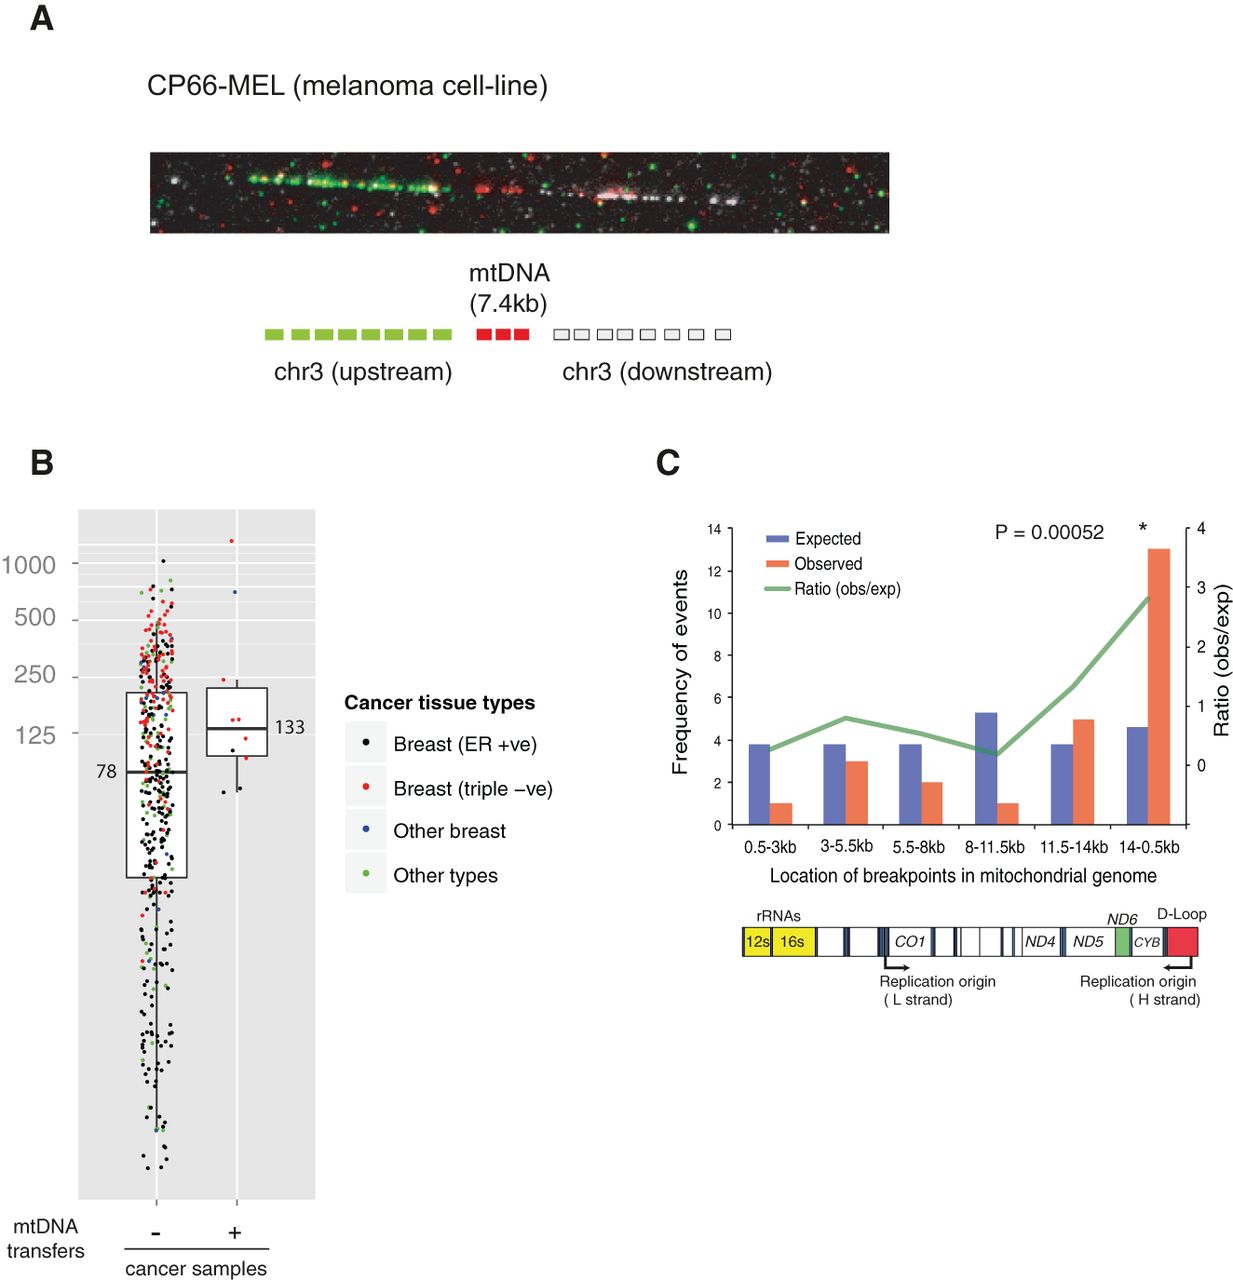
Features of somatic mtDNA nuclear transfer in 12 cancer samples. (A) Fiber FISH visualizes the mitochondrial-nuclear DNA fusion from the CP66-MEL cell line. (B) Positive correlation between mtDNA transfer and numbers of nuclear chromosomal rearrangements (large deletion, tandem duplication, inversion, and translocation) in cancer genomes. Median values are shown. (C) mtDNA breakpoints are enriched in the 14 kb- to 500-bp region of the MT genome. (Top) Blue and red bars represent the expected and observed numbers of breakpoints in each interval of MT genome, respectively. Green line shows ratio between observed and expected numbers. A χ2 test was applied to test enrichment. (Bottom) Schematic structural features of the MT genome corresponding to the intervals are shown.


